INTERNET OF THINGS BASED REAL-TIME WATER QUALITY MONITORING SYSTEM FOR WATER STORAGE TANK
INTERNET OF THINGS BASED REAL-TIME WATER QUALITY MONITORING SYSTEM FOR WATER STORAGE TANK
0
Components
Hardware components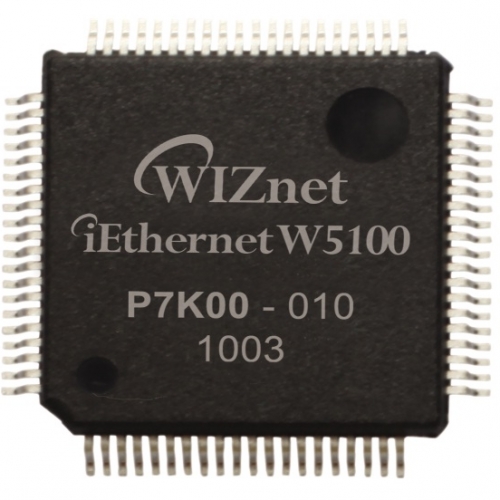
WIZnet - W5100
x 1

Texas Instruments - Temperature Sensor
x 1
Arduino Nano
x 1
pH Sensor
x 1
TDS Sensor
x 1
Turbidity Sensor
x 1
Radio-Frequency Transceiver Module
x 1
Arduino - Arduino IDE
x 1
Ubidots Android Mobile App
x 1
Ubidots Cloud Server
x 1
Project description
Figure 1.? Dirty water storage tank due to deposits and sedimentation (Stara water hygiene, 2020)
The conventional water quality monitoring is carried out by collecting water samples and sending them to laboratories for testing. This process is slow, expensive and wastes manpower. To cope with the problems stated above, a real-time water quality monitoring system is implemented to check the water quality using various sensors. AIM AND OBJECTIVE In this project, the aim is to develop a real-time water quality monitoring system in water storage tanks that can be implemented in society, residential areas and restaurant and food service industry by utilizing Internet of Things technology. The objectives of the project are:- Design and develop an embedded system architecture to perform real-time water quality monitoring based on parameters such as pH, turbidity, temperature and Total Dissolved Solids (TDS).
- Integrating IoT into real-time water quality monitoring system to allow users to observe water quality remotely and alerts users through electronic devices such as smartphones or laptops, when water quality is poor.
- Develop GUI to display the water quality in a graphical format for greater visual interactions.
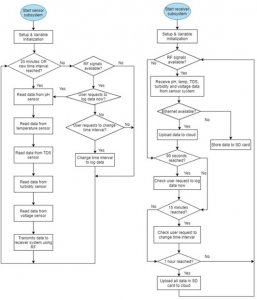
 FLOW CHART
PROTOTYPE DEVELOPMENT
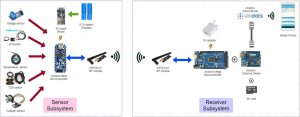
The hardware prototype developed consists of two subsystems: sensor subsystem and receiver subsystem.- ?Sensor subsystem prototype: A water resistant junction box was used to place all electronic components to protect them from water ingress or water splashed around the prototype. The PCB, batteries and sensor modules are able to fit in the junction box as shown in Figure, though there is limited space for the sensor module breakout board but the selected junction box was the best bargain given the amount of cost allocated for this project.
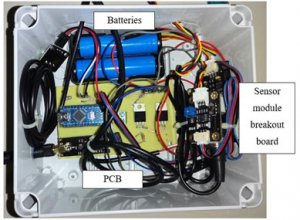
Figure 2 : Electronic hardware system in junction box
Based on Figure 2, two batteries arranged in parallel connection are located at the top of the box and and a 5V USB boost converter will power up the PCB from the Arduino Nano located at the centre of the box. The right side of the box is where the sensor module breakout boards are placed. Six holes of different sizes were drilled to allow the four sensor probes and antenna of nRF24L01 to pass through the junction box as well as to place the main switch for the electronic system. The size of holes depend on the diameter of the probes and wires and the holes were later sealed with silicone sealant and hot glue to prevent water from entering into the box.
In order to place the box on the float with even weight distribution, the box was adjusted to be placed in the middle and above an acrylic sheet. Four L-brackets were used to fasten the junction box and acrylic sheet. The L-brackets were directly screwed and fixed in place using electric screwdriver. Next, six nylon cable ties were used to fasten the acrylic sheet to the PVC float. As for the float, PVC pipe was cut into four segments based on the dimensions calculated and joined by 90º PVC elbows glued using PVC solvent cement. After that, four holes of different sizes were drilled on the acrylic sheet to allow the pH, temperature, TDS and turbidity probes to pass through and immerse in water. The probes were then fixed and glued especially the turbidity sensor as its top is not waterproof. The final prototype of the sensor subsystem is shown in front, top and side views in Figures 3 to 5 below.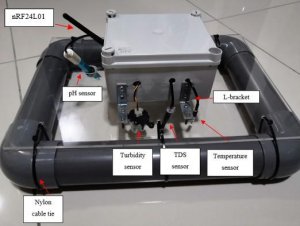
Figure 3: Sensor Subsystem Prototype Front View
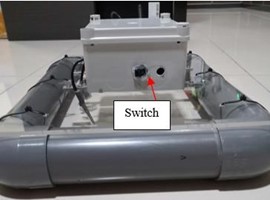
Figure 4: Sensor Subsystem Prototype Side View
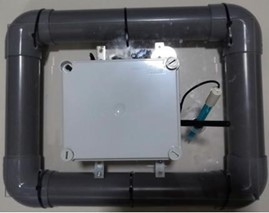
Figure 5: Sensor Subsystem Prototype Top View
- Receiver Subsystem Prototype :??The receiver subsystem is placed indoor next to the router which consists of Arduino Ethernet shield with Arduino Mega powered by 5 V adapter as shown in Figure 4.16. The two-way communication is through the RF module and data received by this subsystem will be uploaded to the cloud via the Ethernet connection from the RJ45 Ethernet cable.
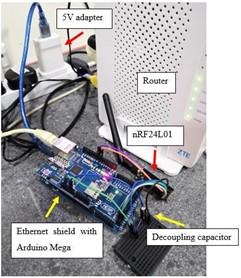
Figure 6: Receiver Subsystem Prototype
PROTOTYPE PERFORMANCE
- Data Upload and Monitoring On Ubidots Cloud: The receiver subsystem is designed to work such that when data from sensor subsystem is received and internet connection is available, it would upload the data to Ubidots cloud. The data will be stored in Ubidots database and is displayed via the graphical user interface (GUI) or dashboard and can be accessed through the Ubidots website or its mobile application.? The number of variables created for this project in the cloud are 12 in which five variables (purple colured) are real-time sensor data and the other five variables are for backup sensor data (green coloured) whilst the remaining two are log real-time data state (yellow coloured) and time interval (red coloured). Figure 7 below shows the variables created in the cloud, where each variable is issued a unique API key so that the sensor data will be stored to the correct variable. The time and date at the time of upload will be captured.
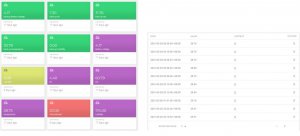
Figure 7: Ubidots cloud database
The dashboard is where the data will be visible to users and displayed in graphical format where the duration range of data is modifiable. Figure 8 shows the snapshot of dashboard for displaying real-time or latest. These static dashboard views are from the Ubidots website viewed from laptop.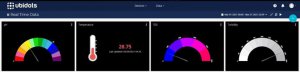
Figure 8:? Snapshot of dashboard for displaying real-time (latest) data
- User Request to Log Real-Time Data or Change Time Interval (Ubidots Mobile Application) :?User may also perform the similar operations earlier (view graphical data or modify user request) by accessing the Ubidots mobile application from mobile phone.
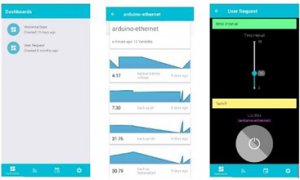 Figure 10: Snapshot of dashboard accessed through Ubidots mobile application

