Radar application with thingspeak
Radar application with thingspeak
2
Components
Hardware components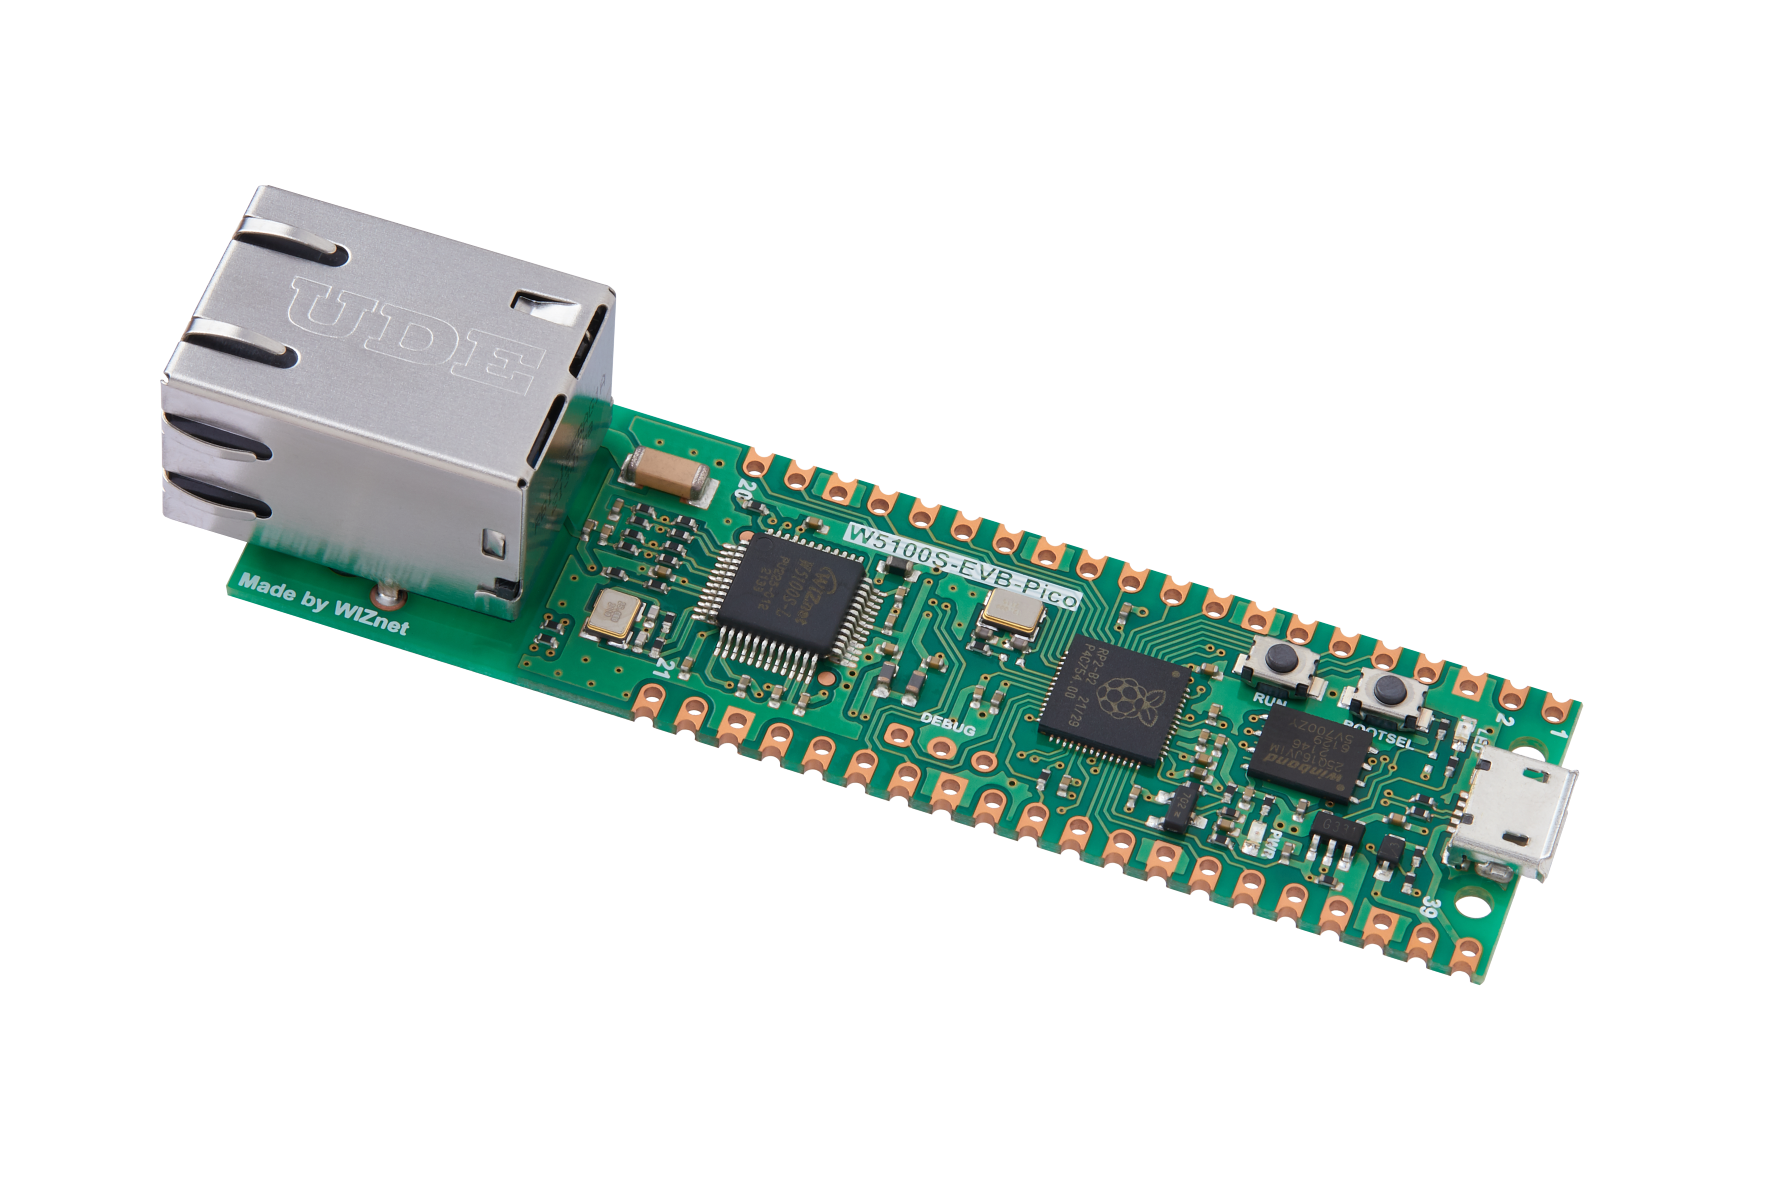
WIZnet - W5100S-EVB-Pico
x 1

Project description
Story
This is my updated version based on RUS-04 ultrasonic sensor with W5100S-EVB-PICO.
Since W5100S-EVB-PICO with circuitpython environments and libraries provides me to have different kinds of possiblities to communicate with different kinds of IOT platform.
I had tried to develop a radar with IOT platform using the current resource that I have.
The platform has been used in this project is Thingspeak
By using Thingspeak's MATLAB Visualizations, I could easily develop a radar display by creating a plotting chart.
For details, please refer to the informaiton below.
Structure Diagram:
The following is the connection structure from the module's to communicate with Thingspeak
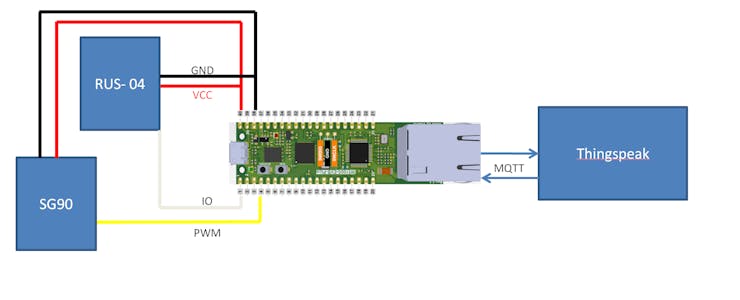
From the image above, it shows the modules for this application are ultrasonic sensor module RUS-04 and Servo motor SG90. The SG90 will be physically connected with RUS-04 to work as a movable ultrasonic sensor.

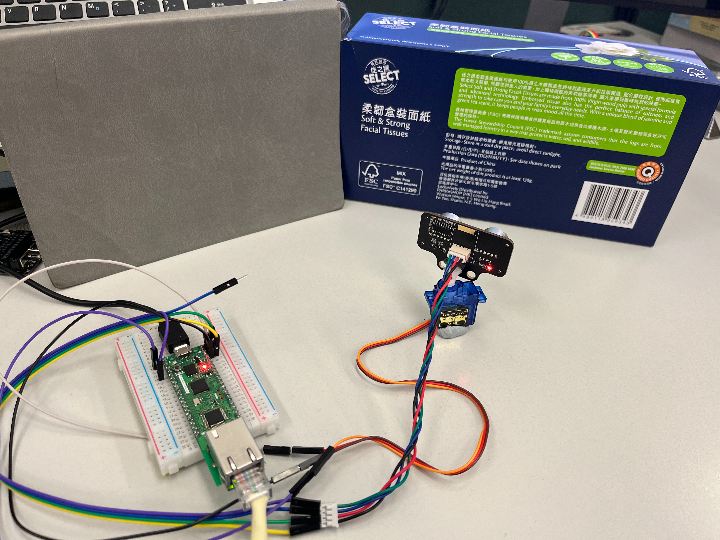
This is how I connected both modules and work it one piece.
After connecting the wiring with W5100S-EVB-PICO, it just required to use few libraries to make it functional.
Programming - modules:
Since I had made some modification with circuitpython library based on HCSR-04 to work on RUS-04 module. I will still keep using circuitpython for this project.
About the development of my previous project, please refer to the link below.
W5100S-EVB-PICO + RUS04 + Adafruit IO in Circuitpython
For making the RUS-04 and SG90 could work correctly, I had made some setup based on the following code.
Libraries:
import pwmio #PWM control for servo
from adafruit_motor import servo #Use servo.py
import adafruit_hcsr04 #Use my previous project's modified Hcsr04 library
IO setups:
# create a PWMOut object on the control pin.
pwm = pwmio.PWMOut(board.GP0, duty_cycle=0, frequency=50)
servo = servo.Servo(pwm)

#Sonar setup
sonar = adafruit_hcsr04.HCSR04(trigger_pin=board.GP2)
RUS-04 + SG90:
#variables to save data
result = [None] * 32
#variables to set the correct format to upload thingspeak
pub = [None] * 4
#collect ultrasonic data from each 5 degree angle
for i in range(32): # Collect 32 data (limitation by thingspeak)
    servo.angle = i*5
    result[i] = sonar.distance
    print(result[i])
    time.sleep(0.08)
for i in range(180): #back to zero point
    servo.angle = 180 - i
    time.sleep(0.01)
After the codes has been set, we could easily collect ultrasonic distance in each 5 degree angle.
ThingSpeak Setup:
After the coding is done, I need to work on the communication with Thingspeak.
Channels:
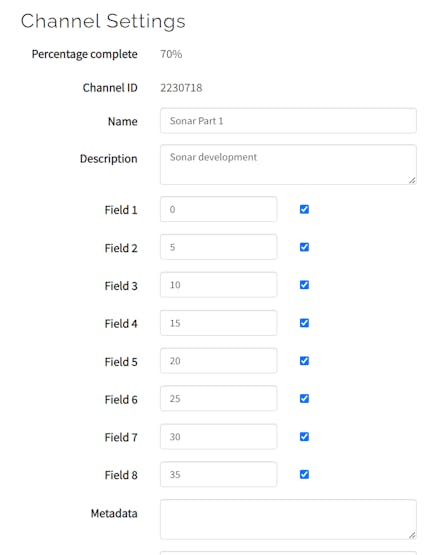
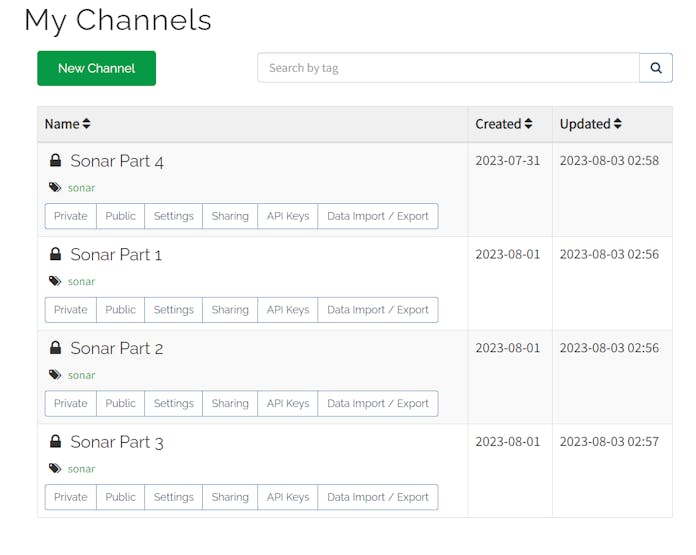
As I mentioned from the above paragraphs, it is required to create 4 channels (free version) to allow me to upload the data to Thingspeak.
Creating channels just required to create a name and remember to open all the fields (feeds) to allow the radar data could go to Thingspeak.
MQTT device:
To allow thingspeak to receive your data from MQTT, it is required us to create a MQTT device in thingspeak included all the channels.
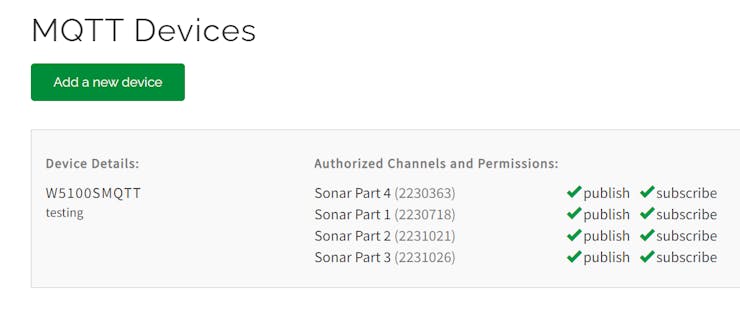
From the image above, I had created a MQTT deivce for all my channels. It has the ability to publish and subscribe MQTT.
After you had done the above settings, the data from W5100S-EVB-PICO will be uploaded to Thingspeak.
Programming - MQTT to Thingspeak:
Adafruit and circuitpython has provided a lot of libraries for me to developing my application. It also has a specific library to allow me to easily communication with Adafruit's IOT platform - Adafruit IO.
However, it does not have graph / chart creation to allow me to create a radar diagram for my project.
Thus, I had found a IOT platform called Thingspeak.
Thingspeak has a application called MATLAB Visualizations. It allows me to organize my data to be a useful information and display in a IOT platform remotely.
The communication method is quite simple as well. It provides user to HTML and MQTT.
Since my data are not that large and I'm used to work on Adafruit's MQTT library.
I had used MQTT protocol to upload the data collected by my SG90 + RUS04 combo.
For having a better understanding for Thingspeak, I found a very useful YouTube video made by Thingspeak. (LINK)
Since I'm just using a free version, it gives me limitation on making a prefect radar.
However, these issue could be solve when you paid for their services.
My current free plan is:
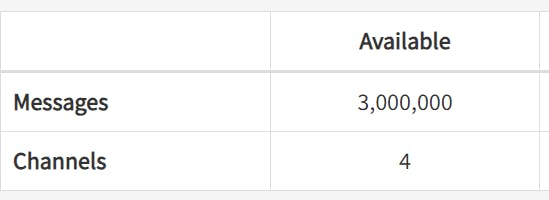
One channel includes 8 feeds (field) therefore I could only upload 32 sets of data for creating my radar.
The second issue is MATLAB Visualizations only provides auto refresh my radar graph.
As I know, the paid version will automatically updates your graph and provide more channels to allow you upload more data with in a limited of time.
Library:
import adafruit_minimqtt.adafruit_minimqtt as MQTTConnect to Thingspeak:
# Initialize MQTT interface with the ethernet interface
MQTT.set_socket(socket, eth)
# Initialize a new MQTT Client object
mqtt_client = MQTT.MQTT(
    broker="mqtt3.thingspeak.com",
    username=secrets["thingspeak_user"],
    password=secrets["thingspeak_pass"],
    client_id=secrets["thingspeak_id"],
    is_ssl=False,
)
Set MQTT topics:
# MQTT Topic
# Use this topic if you'd like to connect to a standard MQTT broker
sonar1 = secrets["thingspeak_sonar1"]
sonar2 = secrets["thingspeak_sonar2"]
sonar3 = secrets["thingspeak_sonar3"]
sonar4 = secrets["thingspeak_sonar4"]
Connect to Thingspeak & subscribe all topics:
#connect to Thingspeak
mqtt_client.connect()
#MQTT subscribe
mqtt_client.subscribe(sonar1)
mqtt_client.subscribe(sonar2)
mqtt_client.subscribe(sonar3)
mqtt_client.subscribe(sonar4)
Upload Ultrasonic data:
#format the codes correctly before upload to thingspeak
#Each channel could only upload 8 feeds (fields), so I need to publish 4 times for
#different channels
pub[0] = "field1={0}&field2={1}&field3={2}&field4={3}&field5={4}&field6={5}&field7={6}&field8={7}".format(result[0],result[1],result[2],result[3],result[4],result[5],result[6],result[7])

pub[1] = "field1={0}&field2={1}&field3={2}&field4={3}&field5={4}&field6={5}&field7={6}&field8={7}".format(result[8],result[9],result[10],result[11],result[12],result[13],result[14],result[15])

pub[2] = "field1={0}&field2={1}&field3={2}&field4={3}&field5={4}&field6={5}&field7={6}&field8={7}".format(result[16],result[17],result[18],result[19],result[20],result[21],result[22],result[23])

pub[3] = "field1={0}&field2={1}&field3={2}&field4={3}&field5={4}&field6={5}&field7={6}&field8={7}".format(result[24],result[25],result[26],result[27],result[28],result[29],result[30],result[31])

#Publish to Thingspeak 4 times to upload all the data
mqtt_client.publish(sonar1, pub[0])
mqtt_client.publish(sonar2, pub[1])
mqtt_client.publish(sonar3, pub[2])
mqtt_client.publish(sonar4, pub[3])
Result from Thonny:

MATLAB Visualizations
After the MQTT device posted on Thingspeak, I could start to create the radar graph with MATLAB Visualizations.
This application is included in Thingspeak.
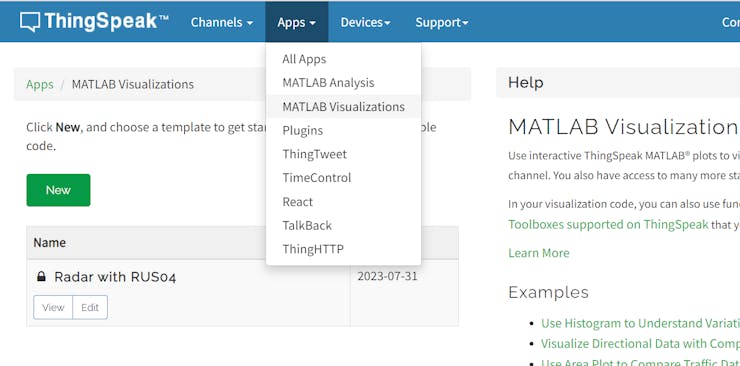
For creating a radar graph, it is required to use MATHLAB's Polarplot coding.
Codes:
% First channel
readChannelID = aaaaaaaaaaaa;
fieldID1 = 1;
fieldID2 = 2;
fieldID3 = 3;
fieldID4 = 4;
fieldID5 = 5;
fieldID6 = 6;
fieldID7 = 7;
fieldID8 = 8;
% Second Channel
readChannelID2 = bbbbbbbbb;
fieldID9 = 1;
fieldID10 = 2;
fieldID11 = 3;
fieldID12 = 4;
fieldID13 = 5;
fieldID14 = 6;
fieldID15 = 7;
fieldID16 = 8;
% Third Channel
readChannelID3 = ccccccccccccc;
fieldID17 = 1;
fieldID18 = 2;
fieldID19 = 3;
fieldID20 = 4;
fieldID21 = 5;
fieldID22 = 6;
fieldID23 = 7;
fieldID24 = 8;
% Fourth Channel
readChannelID4 =dddddddddddd;
fieldID25 = 1;
fieldID26 = 2;
fieldID27 = 3;
fieldID28 = 4;
fieldID29 = 5;
fieldID30 = 6;
fieldID31 = 7;
fieldID32 = 8;

% Channel Read API Key
% If your channel is private, then enter the read API
% Key between the '' below:
readAPIKey = 'EEEEEEEEEEE';
readAPIKey2 = 'FFFFFFFFFFFF';
readAPIKey3 = 'GGGGGGGGGGGG';
readAPIKey4 = 'HHHHHHHHHHHHHHHH';

%% Read Data from all fields (feeds)
data1 = thingSpeakRead(readChannelID, 'Field', fieldID1, 'NumPoints', 1, 'ReadKey', readAPIKey);
data2 = thingSpeakRead(readChannelID, 'Field', fieldID2, 'NumPoints', 1, 'ReadKey', readAPIKey);
data3 = thingSpeakRead(readChannelID, 'Field', fieldID3, 'NumPoints', 1, 'ReadKey', readAPIKey);
data4 = thingSpeakRead(readChannelID, 'Field', fieldID4, 'NumPoints', 1, 'ReadKey', readAPIKey);
data5 = thingSpeakRead(readChannelID, 'Field', fieldID5, 'NumPoints', 1, 'ReadKey', readAPIKey);
data6 = thingSpeakRead(readChannelID, 'Field', fieldID6, 'NumPoints', 1, 'ReadKey', readAPIKey);
data7 = thingSpeakRead(readChannelID, 'Field', fieldID7, 'NumPoints', 1, 'ReadKey', readAPIKey);
data8 = thingSpeakRead(readChannelID, 'Field', fieldID8, 'NumPoints', 1, 'ReadKey', readAPIKey);
data9 = thingSpeakRead(readChannelID2, 'Field', fieldID9, 'NumPoints', 1, 'ReadKey', readAPIKey2);
data10 = thingSpeakRead(readChannelID2, 'Field', fieldID10, 'NumPoints', 1, 'ReadKey', readAPIKey2);
data11 = thingSpeakRead(readChannelID2, 'Field', fieldID11, 'NumPoints', 1, 'ReadKey', readAPIKey2);
data12 = thingSpeakRead(readChannelID2, 'Field', fieldID12, 'NumPoints', 1, 'ReadKey', readAPIKey2);
data13 = thingSpeakRead(readChannelID2, 'Field', fieldID13, 'NumPoints', 1, 'ReadKey', readAPIKey2);
data14 = thingSpeakRead(readChannelID2, 'Field', fieldID14, 'NumPoints', 1, 'ReadKey', readAPIKey2);
data15 = thingSpeakRead(readChannelID2, 'Field', fieldID15, 'NumPoints', 1, 'ReadKey', readAPIKey2);
data16 = thingSpeakRead(readChannelID2, 'Field', fieldID16, 'NumPoints', 1, 'ReadKey', readAPIKey2);
data17 = thingSpeakRead(readChannelID3, 'Field', fieldID17, 'NumPoints', 1, 'ReadKey', readAPIKey3);
data18 = thingSpeakRead(readChannelID3, 'Field', fieldID18, 'NumPoints', 1, 'ReadKey', readAPIKey3);
data19 = thingSpeakRead(readChannelID3, 'Field', fieldID19, 'NumPoints', 1, 'ReadKey', readAPIKey3);
data20 = thingSpeakRead(readChannelID3, 'Field', fieldID20, 'NumPoints', 1, 'ReadKey', readAPIKey3);
data21 = thingSpeakRead(readChannelID3, 'Field', fieldID21, 'NumPoints', 1, 'ReadKey', readAPIKey3);
data22 = thingSpeakRead(readChannelID3, 'Field', fieldID22, 'NumPoints', 1, 'ReadKey', readAPIKey3);
data23 = thingSpeakRead(readChannelID3, 'Field', fieldID23, 'NumPoints', 1, 'ReadKey', readAPIKey3);
data24 = thingSpeakRead(readChannelID3, 'Field', fieldID24, 'NumPoints', 1, 'ReadKey', readAPIKey3);
data25 = thingSpeakRead(readChannelID4, 'Field', fieldID25, 'NumPoints', 1, 'ReadKey', readAPIKey4);
data26 = thingSpeakRead(readChannelID4, 'Field', fieldID26, 'NumPoints', 1, 'ReadKey', readAPIKey4);
data27 = thingSpeakRead(readChannelID4, 'Field', fieldID27, 'NumPoints', 1, 'ReadKey', readAPIKey4);
data28 = thingSpeakRead(readChannelID4, 'Field', fieldID28, 'NumPoints', 1, 'ReadKey', readAPIKey4);
data29 = thingSpeakRead(readChannelID4, 'Field', fieldID29, 'NumPoints', 1, 'ReadKey', readAPIKey4);
data30 = thingSpeakRead(readChannelID4, 'Field', fieldID30, 'NumPoints', 1, 'ReadKey', readAPIKey4);
data31 = thingSpeakRead(readChannelID4, 'Field', fieldID31, 'NumPoints', 1, 'ReadKey', readAPIKey4);
data32 = thingSpeakRead(readChannelID4, 'Field', fieldID32, 'NumPoints', 1, 'ReadKey', readAPIKey4);

%% Process Data
% Set the angles. Change from degee to Radian
theta1 = deg2rad(0)
theta2 = deg2rad(5)
theta3 = deg2rad(10)
theta4 = deg2rad(15)
theta5 = deg2rad(20)
theta6 = deg2rad(25)
theta7 = deg2rad(30)
theta8 = deg2rad(35)
theta9 = deg2rad(40)
theta10 = deg2rad(45)
theta11 = deg2rad(50)
theta12 = deg2rad(55)
theta13 = deg2rad(60)
theta14 = deg2rad(65)
theta15 = deg2rad(70)
theta16 = deg2rad(75)
theta17 = deg2rad(80)
theta18 = deg2rad(85)
theta19 = deg2rad(90)
theta20 = deg2rad(95)
theta21 = deg2rad(100)
theta22 = deg2rad(105)
theta23 = deg2rad(110)
theta24 = deg2rad(115)
theta25 = deg2rad(120)
theta26 = deg2rad(125)
theta27 = deg2rad(130)
theta28 = deg2rad(135)
theta29 = deg2rad(140)
theta30 = deg2rad(145)
theta31 = deg2rad(150)
theta32 = deg2rad(155)

%Input data to rho
rho1 = data1
rho2 = data2
rho3 = data3
rho4 = data4
rho5 = data5
rho6 = data6
rho7 = data7
rho8 = data8
rho9 = data9
rho10 = data10
rho11 = data11
rho12 = data12
rho13 = data13
rho14 = data14
rho15 = data15
rho16 = data16
rho17 = data17
rho18 = data18
rho19 = data19
rho20 = data20
rho21 = data21
rho22 = data22
rho23 = data23
rho24 = data24
rho25 = data25
rho26 = data26
rho27 = data27
rho28 = data28
rho29 = data29
rho30 = data30
rho31 = data31
rho32 = data32

%% Visualize Data
polarplot(theta1,rho1,'*',theta2,rho2,'*',theta3,rho3,'*',theta3,rho3,'*',theta4,rho4,'*',theta5,rho5,'*',theta6,rho6,'*',theta7,rho7,'*',theta8,rho8,'*',theta9,rho9,'*',theta10,rho10,'*',theta11,rho11,'*',theta12,rho12,'*',theta13,rho13,'*',theta14,rho14,'*',theta15,rho15,'*',theta16,rho16,'*',theta17,rho17,'*',theta18,rho18,'*',theta19,rho19,'*',theta20,rho20,'*',theta21,rho21,'*',theta22,rho22,'*',theta23,rho23,'*',theta24,rho24,'*',theta25,rho25,'*',theta26,rho26,'*',theta27,rho27,'*',theta28,rho28,'*',theta29,rho29,'*',theta30,rho30,'*',theta31,rho31,'*',theta32,rho32,'*')

% Set the graph from 0 to 180 degree
thetalim([0 180])
Result
After you had press save and run, it will showed the following image like below.

By comparing with the actual testing environment, it shows the graph could show a similiar result.

YouTube
At last, I had made a YouTube demo video for my project.


