Visualize office temperature and humidity with Arduino and Datadog
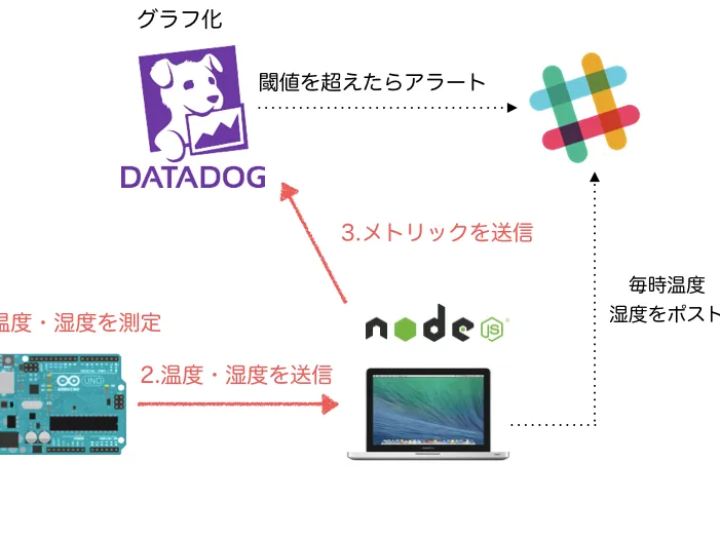
This time, I will use Arduino, which was sleeping at my home, and Datadog, which is used to monitor the infrastructure, to visualize
3
Components
Hardware components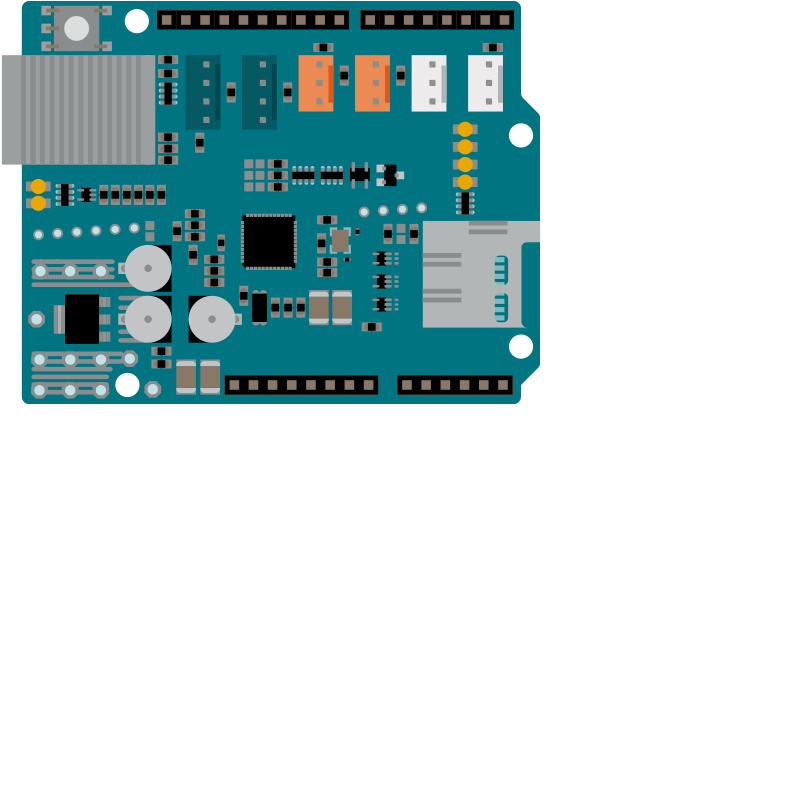
Arduino - Arduino Ethernet Shield 2
x 1

Project description
こんにちは、プレイドの @ikemonn です。 プレイドではKARTEというサービスを提供しており、私は主にインフラ側を担当しております。 今回は私の自宅で眠っていたArduinoとインフラの監視で利用しているDatadogを使用してオフィスの温度・湿度を可視化しようと思います。 概要 Datadogとは、システムモニタリングツールで、Karteではサーバの監視やAPIのレスポンタイムの可視化、AWSの利用金額のモニタリング等に利用しています。 AWSやSlack、PagerDutyなど様々なサービスとの連携もしやすく重宝しています。 今回は下記のような手順で温度・湿度をArduinoで計測しDatadogにデータを投げてグラフとして表示させます。 Arduino UnoだとEthernet Shield2を使用しても、https通信は厳しいようなので一旦Nodeサーバにhttp通信でデータを送ってNodeサーバからDatadogのAPIを叩きにいきます。 Arduinoで温度・湿度を計測する ArduinoからMac上で動かしているNode.jsのサーバに温度・湿度を送信する Node.jsサーバが温度・湿度を受け取ったらDatadogにデータを送る また毎時&異常値が出た時にSlackに通知するように設定します。 Mac上のcronで毎時、温度・湿度をSlackに通知…
Keep reading with a free account
Guests can read 15 projects per visit. Log in or create a free account to read the full description, open the documents and join the comments.