How to show DHT11 data on a QIoT Dashboard?
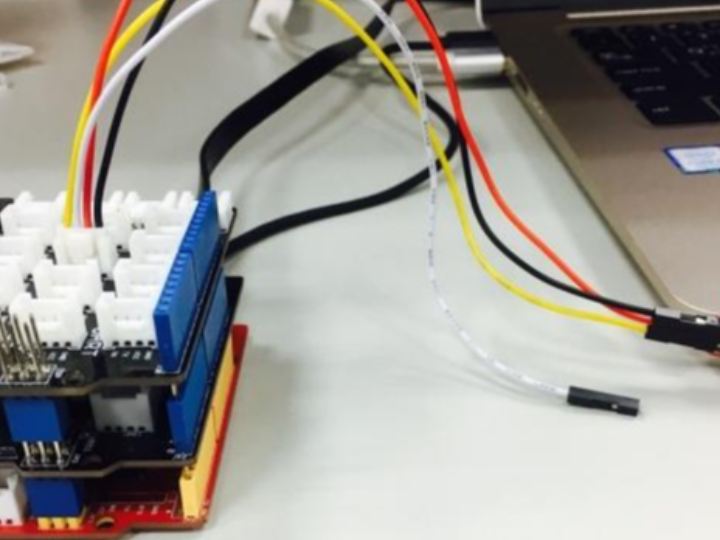
This tutorial will show you how to display DHT11 data on a QIoT Dashboard (using a Seeeduino with W5500 Ethernet Shield).
0
Components
Hardware components
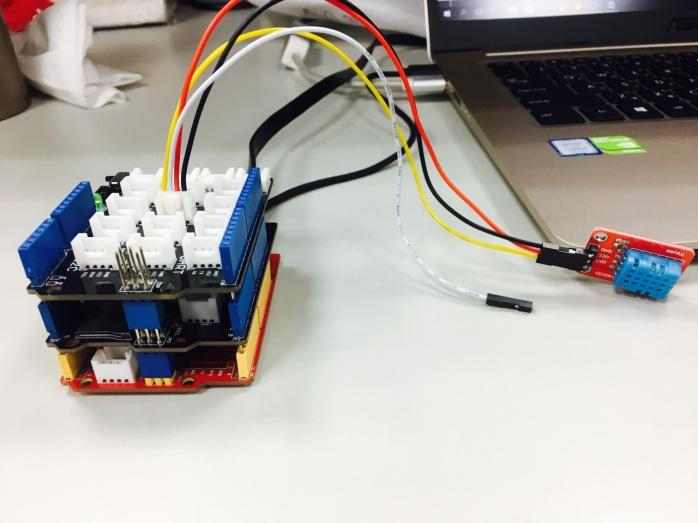
DFRobot - Gravity: DHT11 Temperature Humidity Sensor For Arduino
x 1

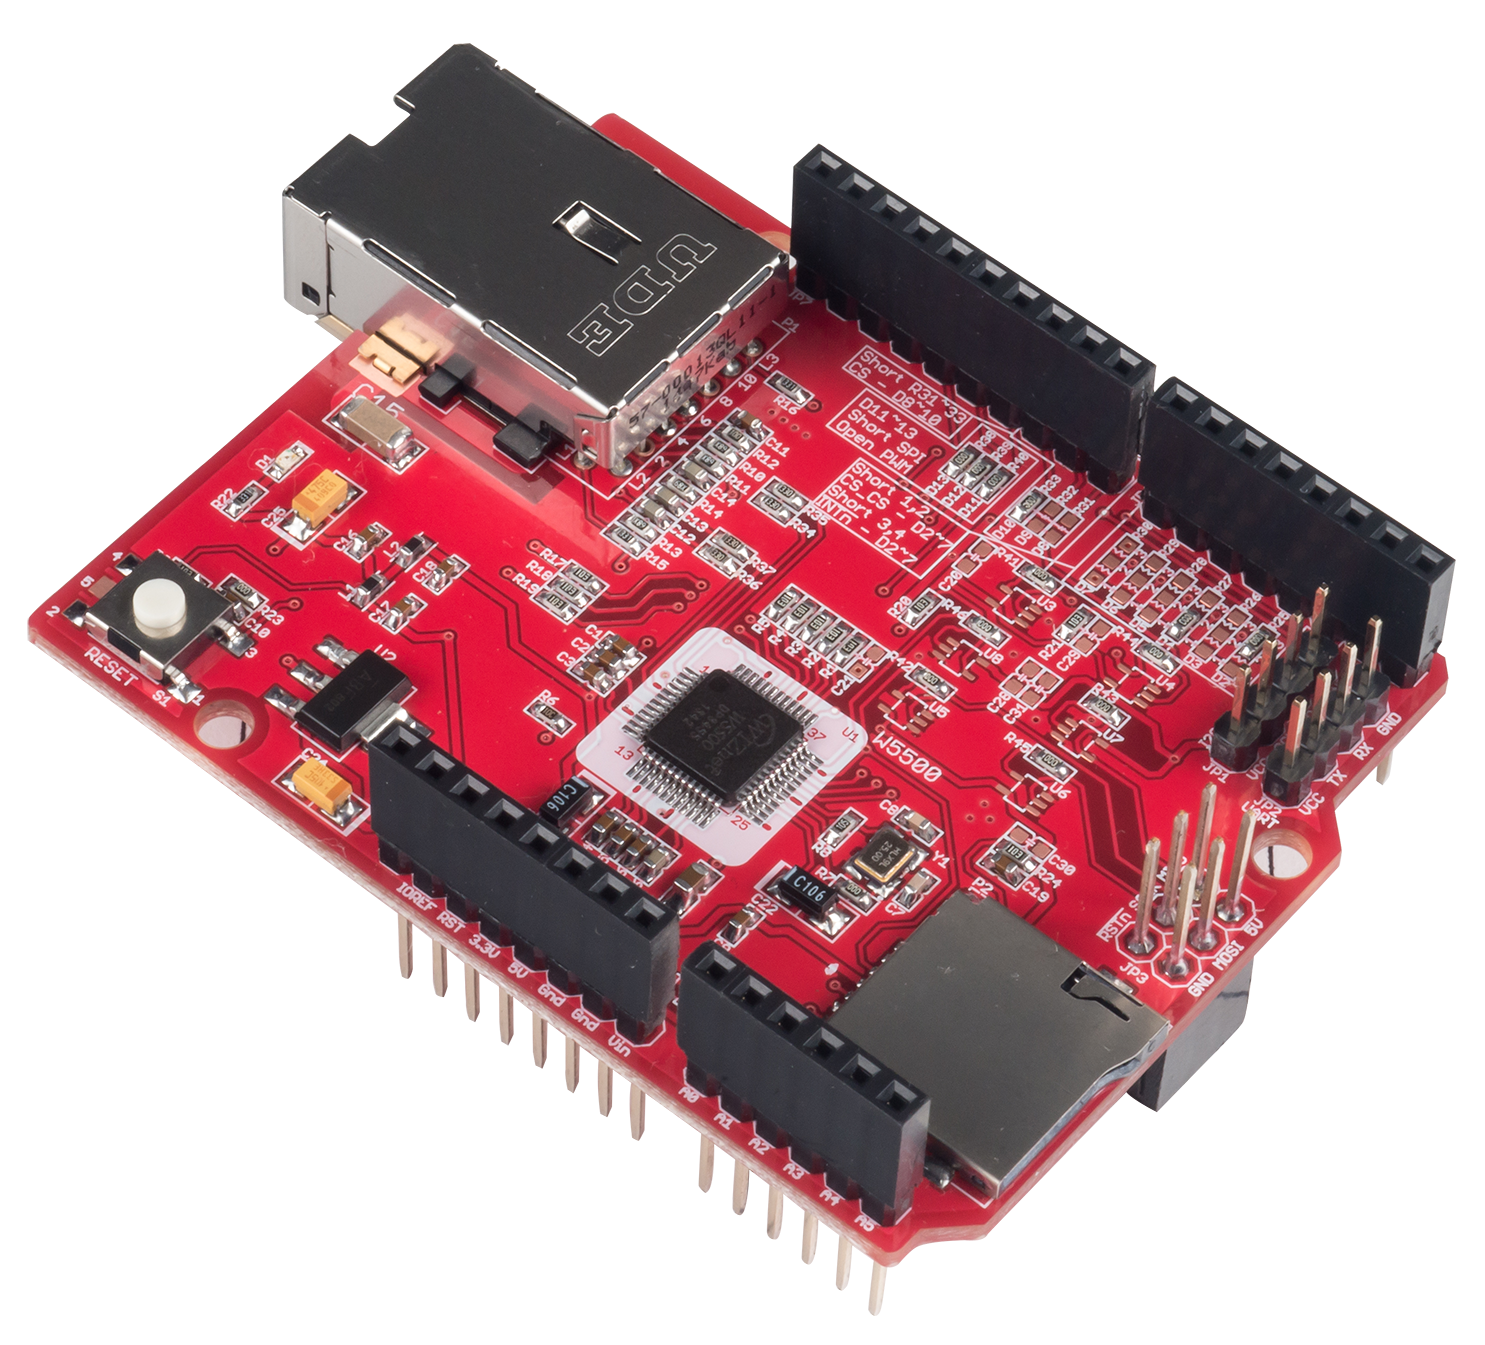
WIZnet - W5500 Ethernet Shield
x 1
Project description
The DHT11 is a basic, low-cost digital temperature and humidity sensor. This tutorial will show you how to display DHT11 data on a QIoT Dashboard (using a Seeeduino with W5500 Ethernet Shield).
- Go to "IoT Applications" > "Add IoT applications"
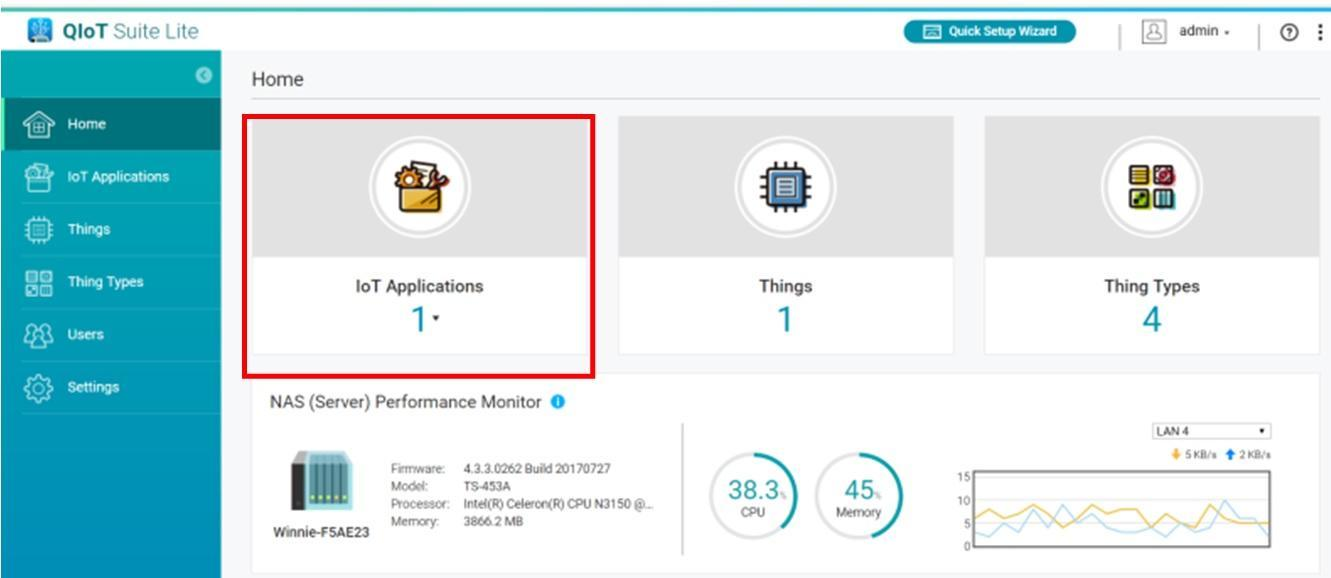
- In "Create a New IoT application":
- Enter a name for the IoT Application.
- The Rule name and Dashboard name will be automatically generated based on the IoT Application Name.
- Click "Create".

- In "Add Thing":
- Enter a name for the Thing (in this sample: "Thingname").
- Select "Custom" in "Thing Category".
- Click "Add".

- Click the "Thing Resources" button, and enter "Thing Resource".

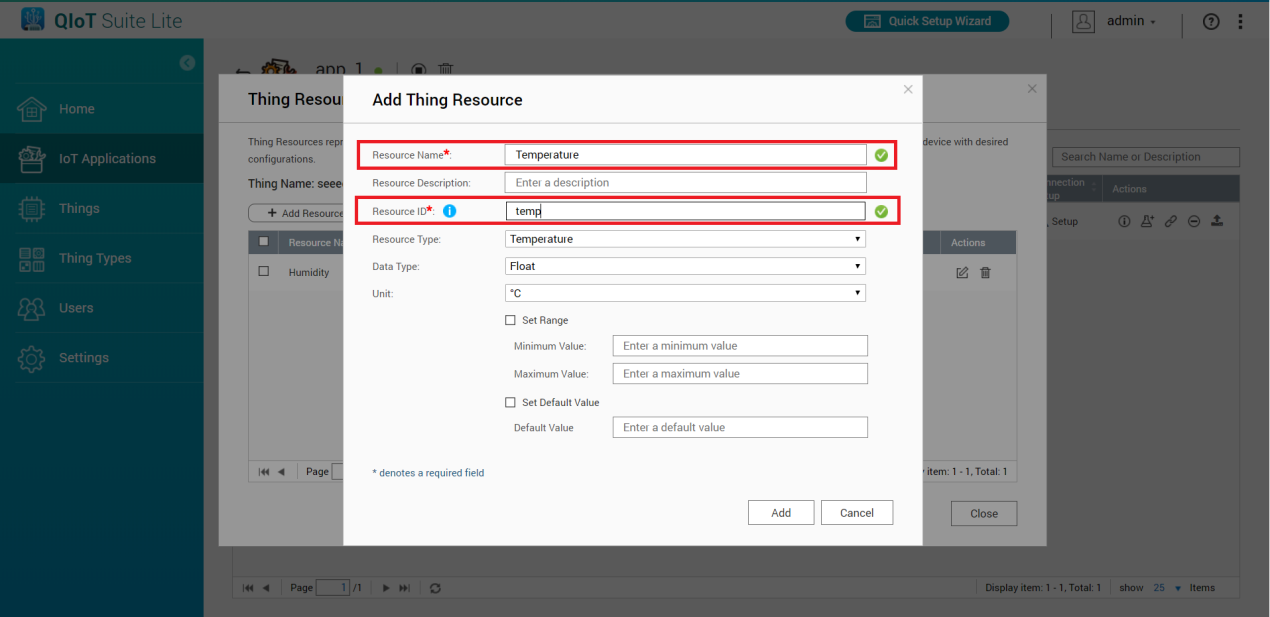
- In "Add Thing Resource":
- Enter a name for the resource (in this example: "Temperature").
- Enter a resource ID.
(The resource ID is used to create a topic in the QIoT broker. This ID should be unique for the device and no duplicates should be used for the same device). - Click "Add".
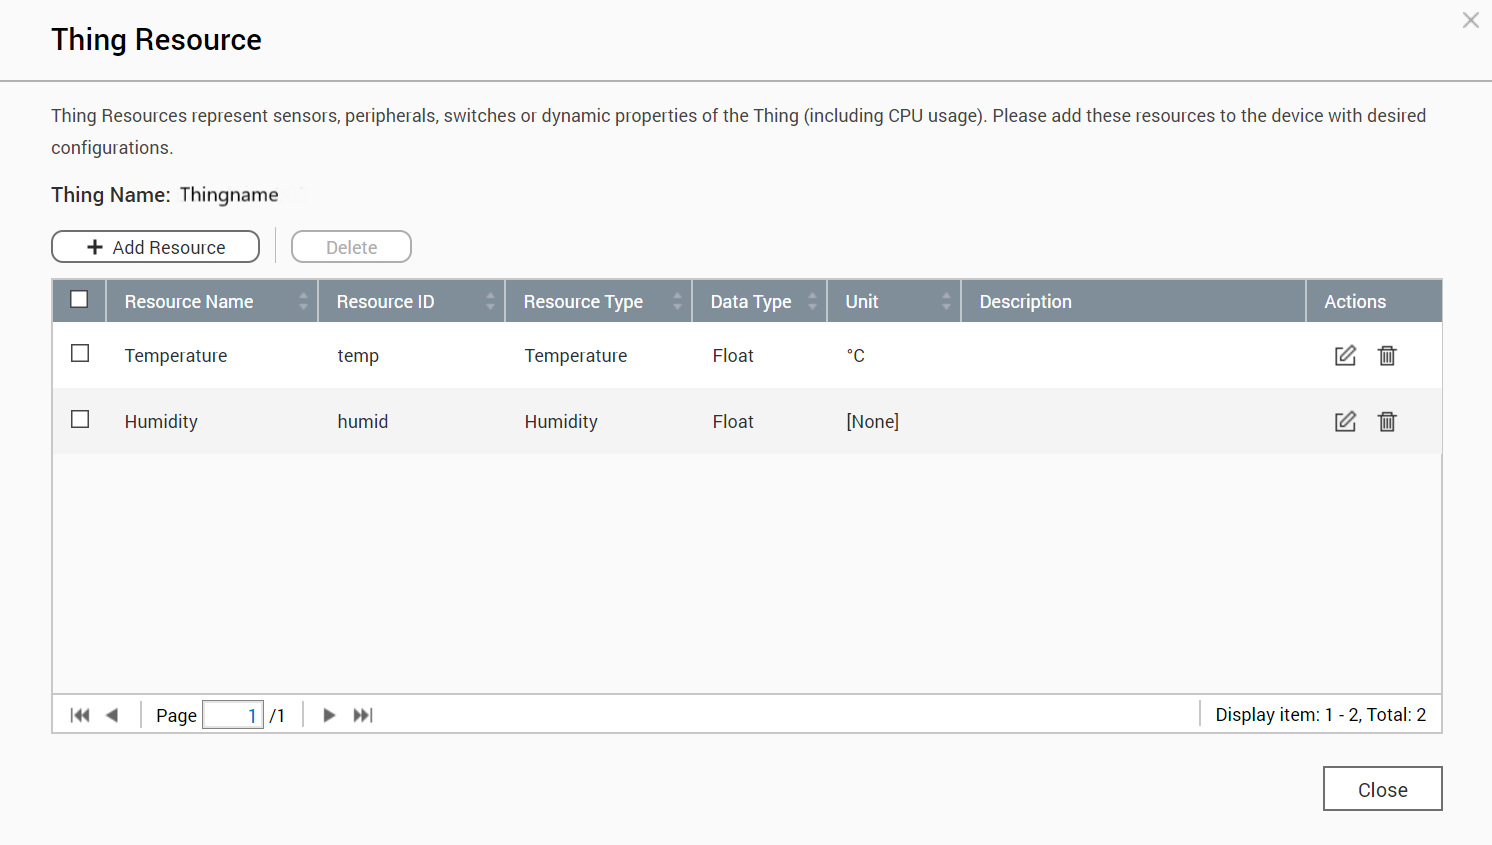
- Add "Thing Resources" (both Temperature and Humidity).
- Click "Connect to device", and in " Thing Information" choose "MQTT", click "Next", and click "download JSON file".


- You can get the example codefrom :
https://github.com/qnap-dev/qnap-qiot-sdks/blob/master/projects/seeeduino-dht11-example/mqtt-seeeduino-dht11-example/mqtt-seeeduino-dht11-example.ino - Open the JSON file downloaded in step 6, and copy the code (ip, port, client id, username, password, temperature topic and humidity topic) to override the sample code in step 7. After copying, upload the file.
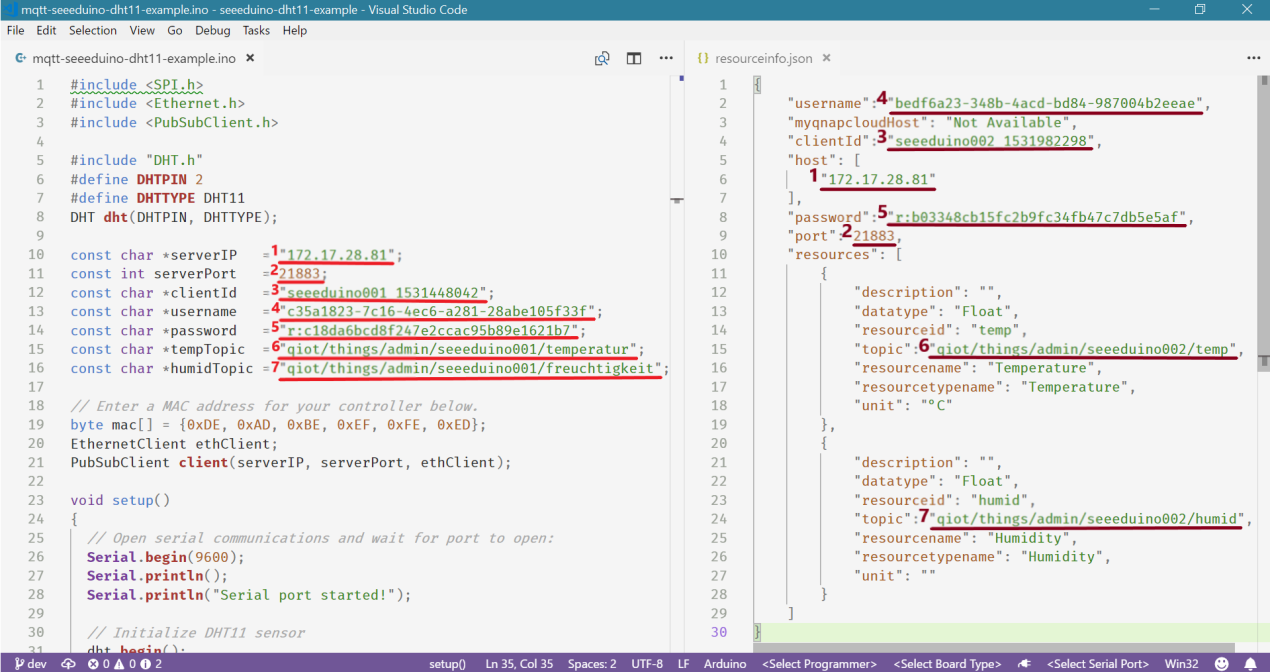
- Return to dashboard page, and follow these steps:
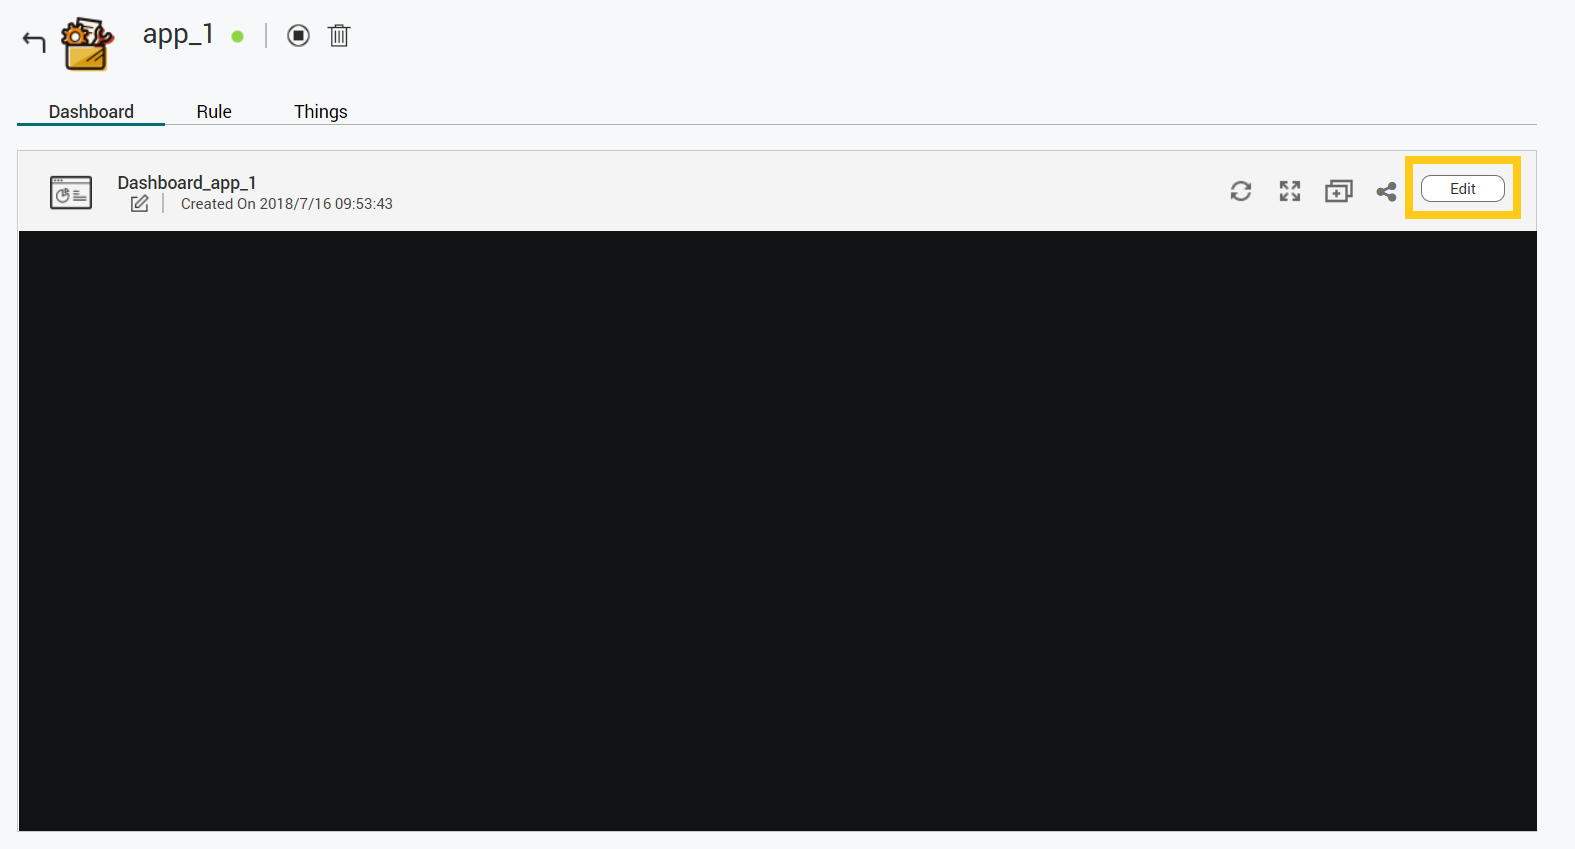
- Click "Edit".
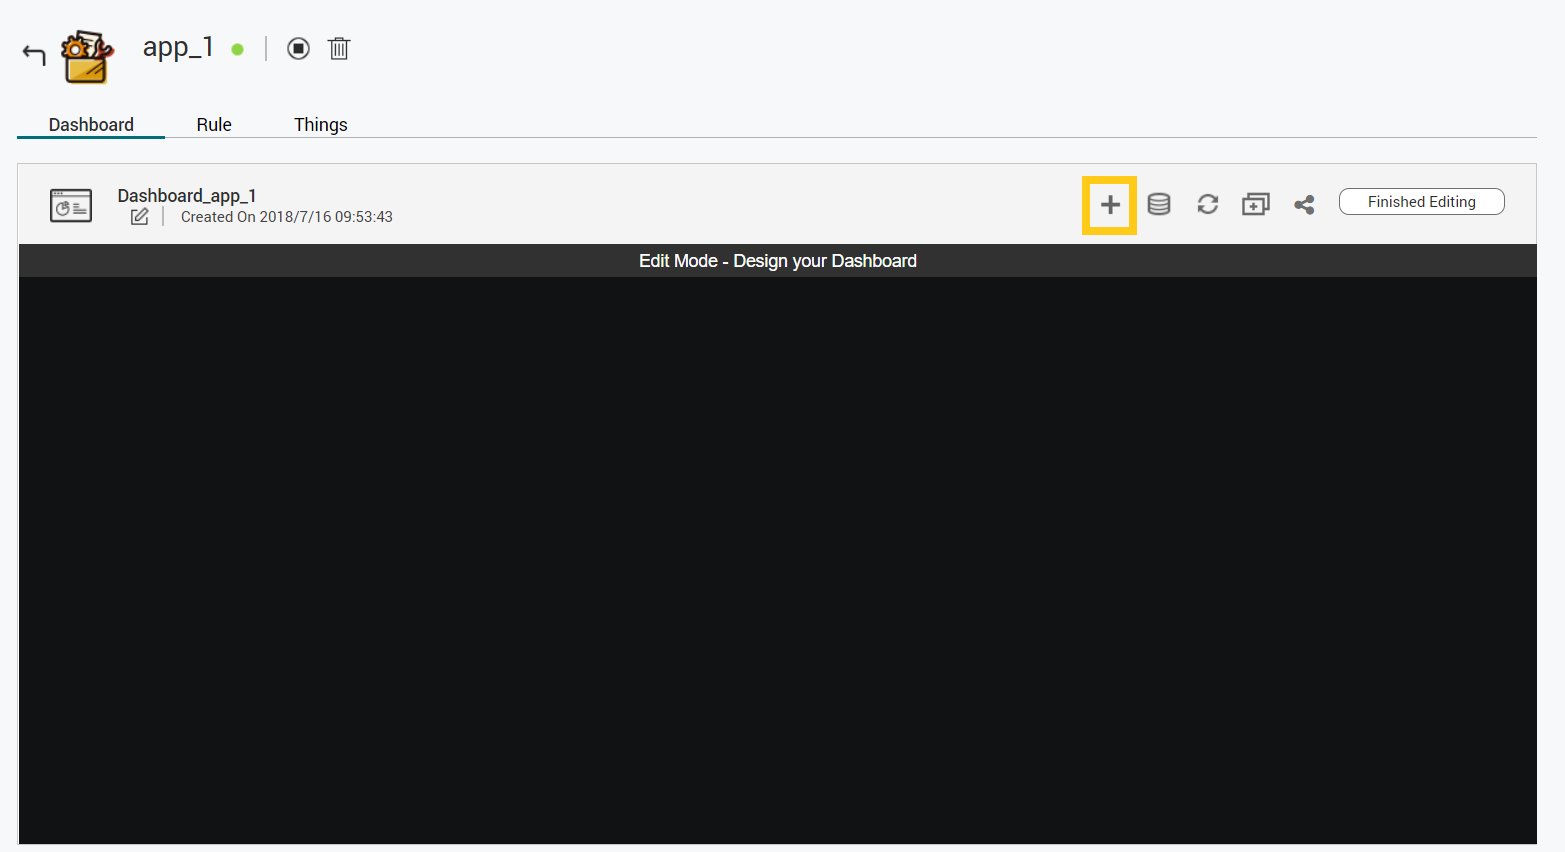
- Add a "Pane by clicking "+".
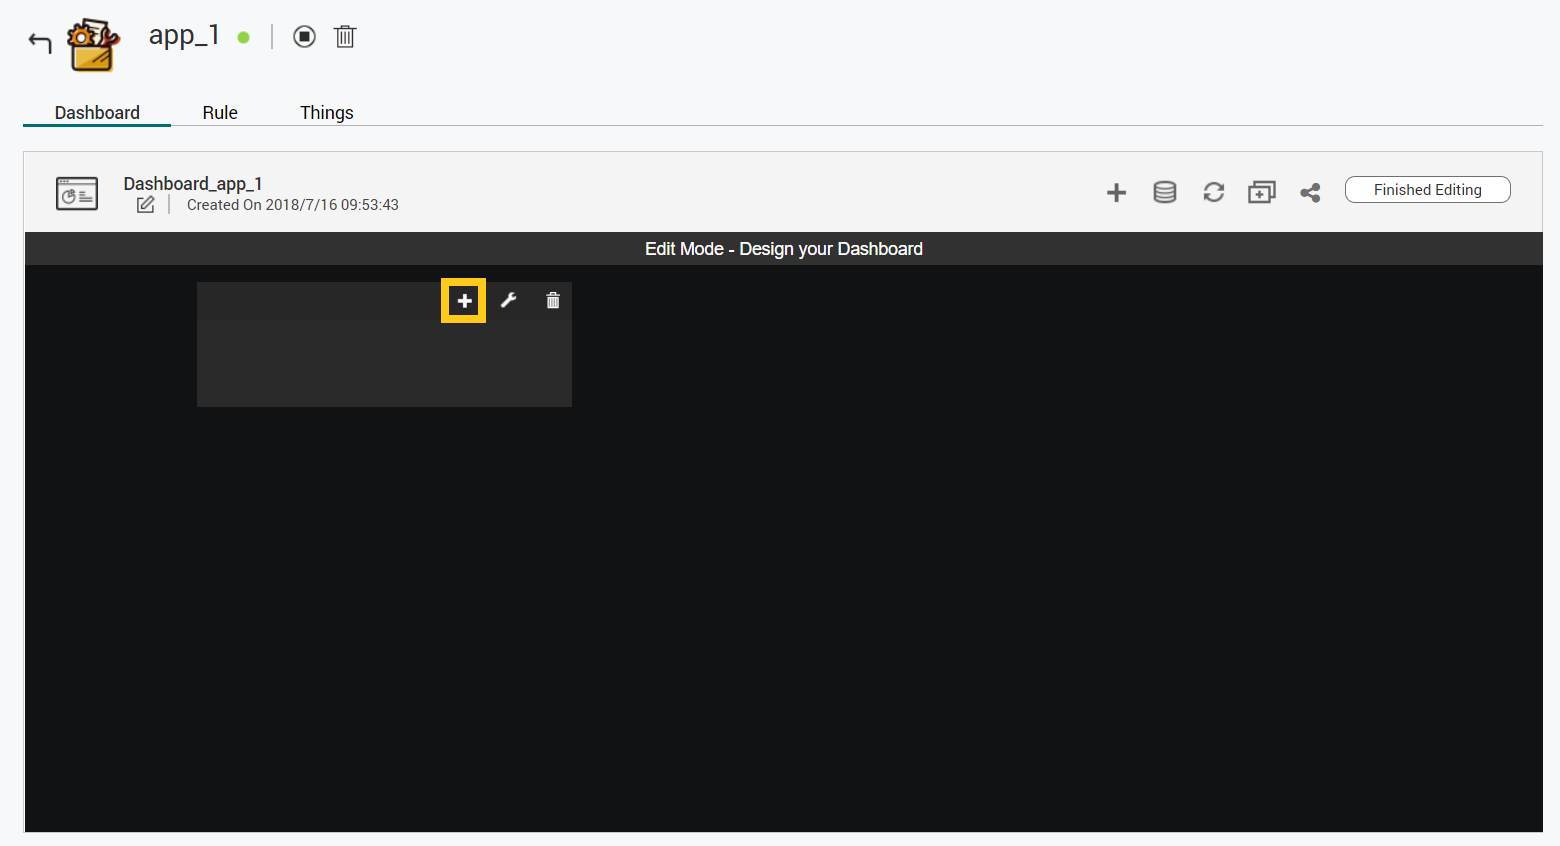
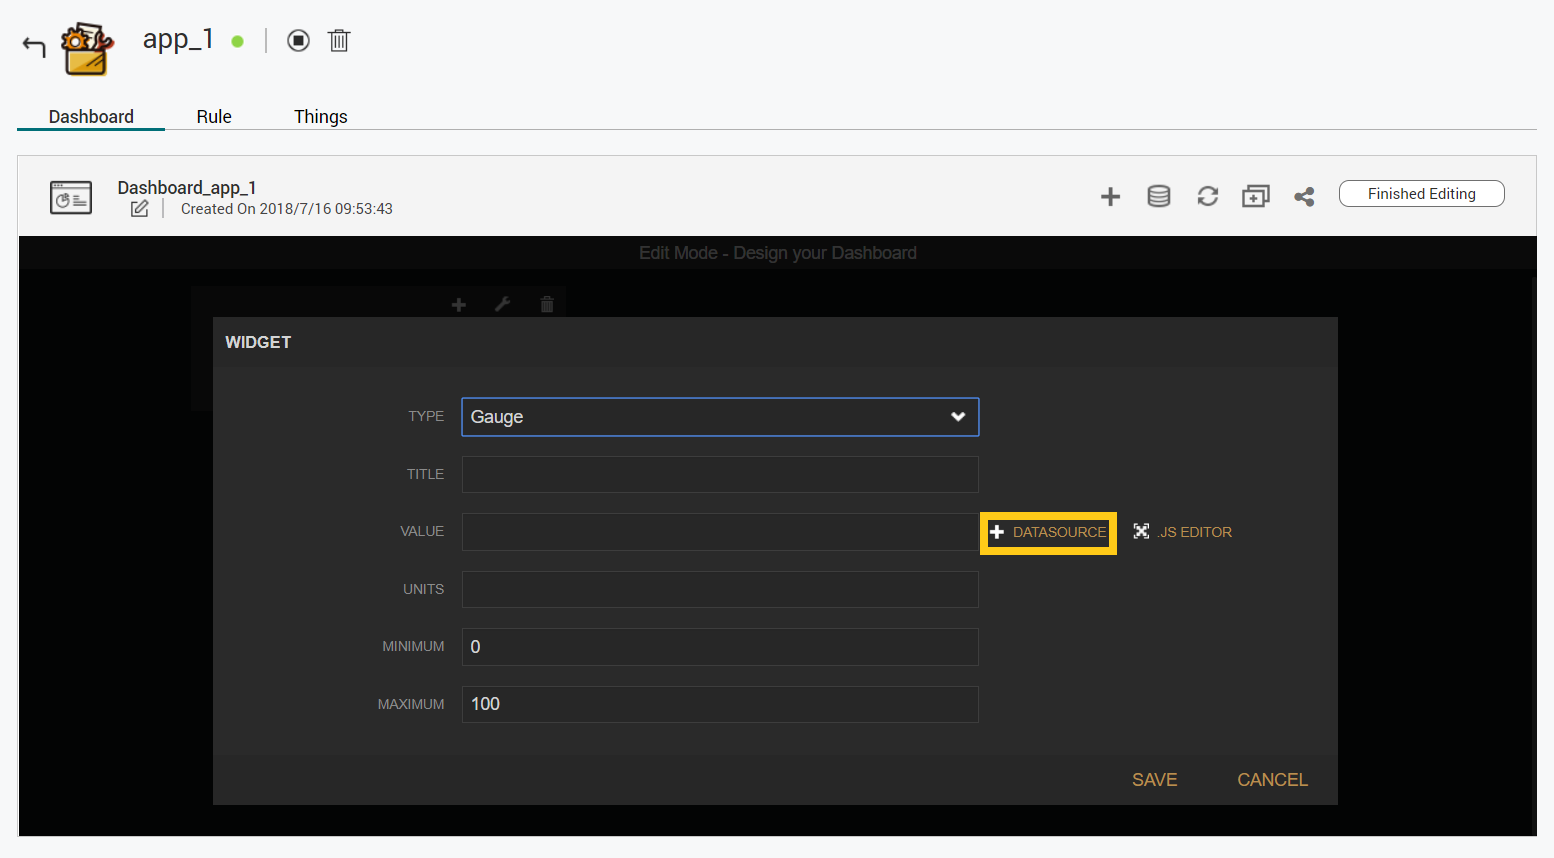
- Add a widget by clicking "+".
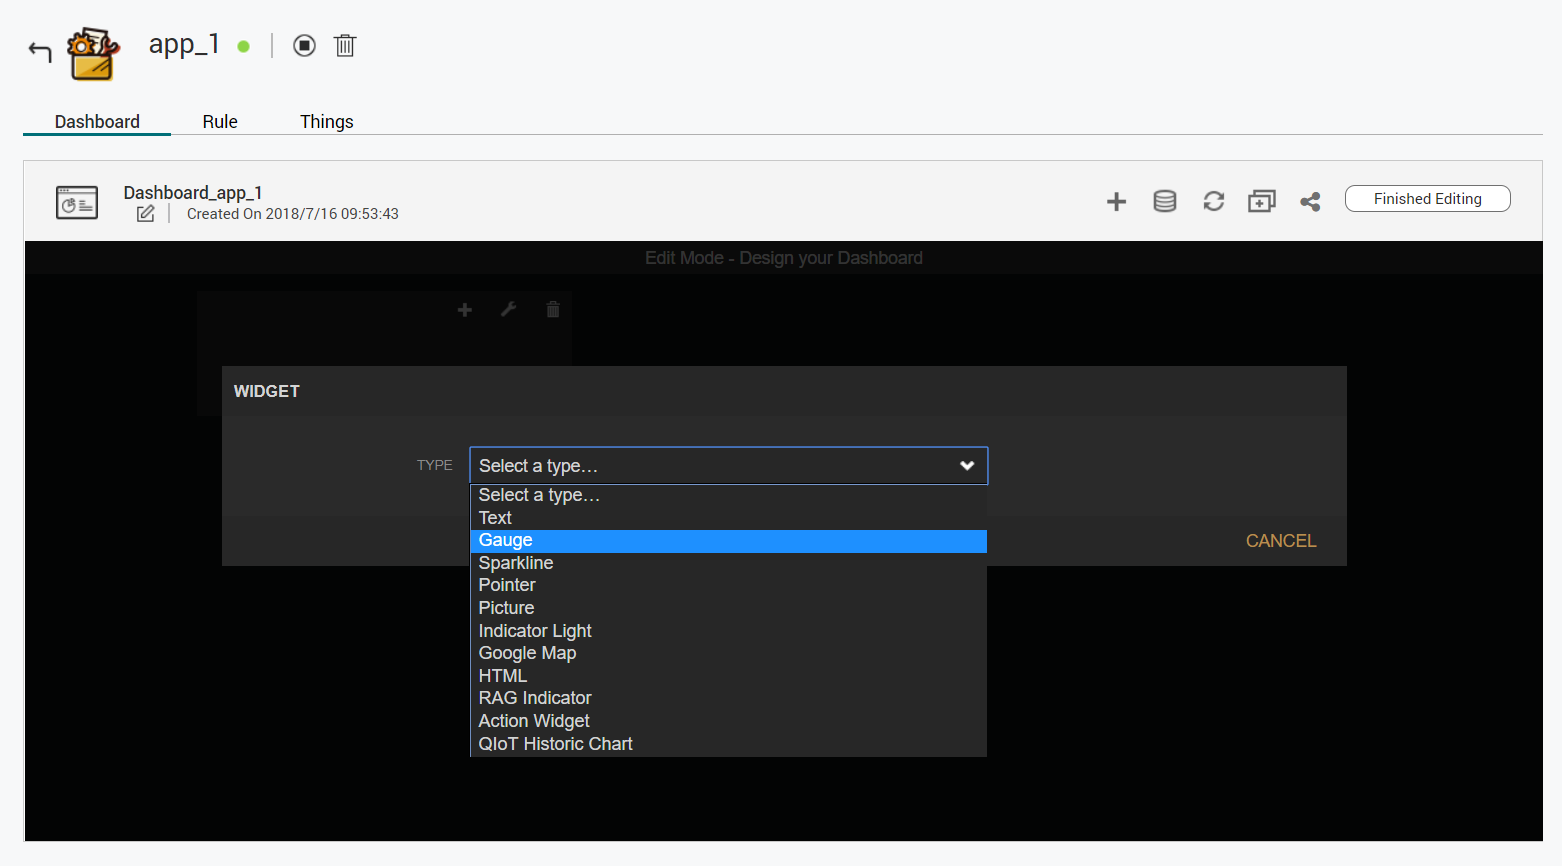
- Select "Gauge".
- Click "+ DATASOURCE".
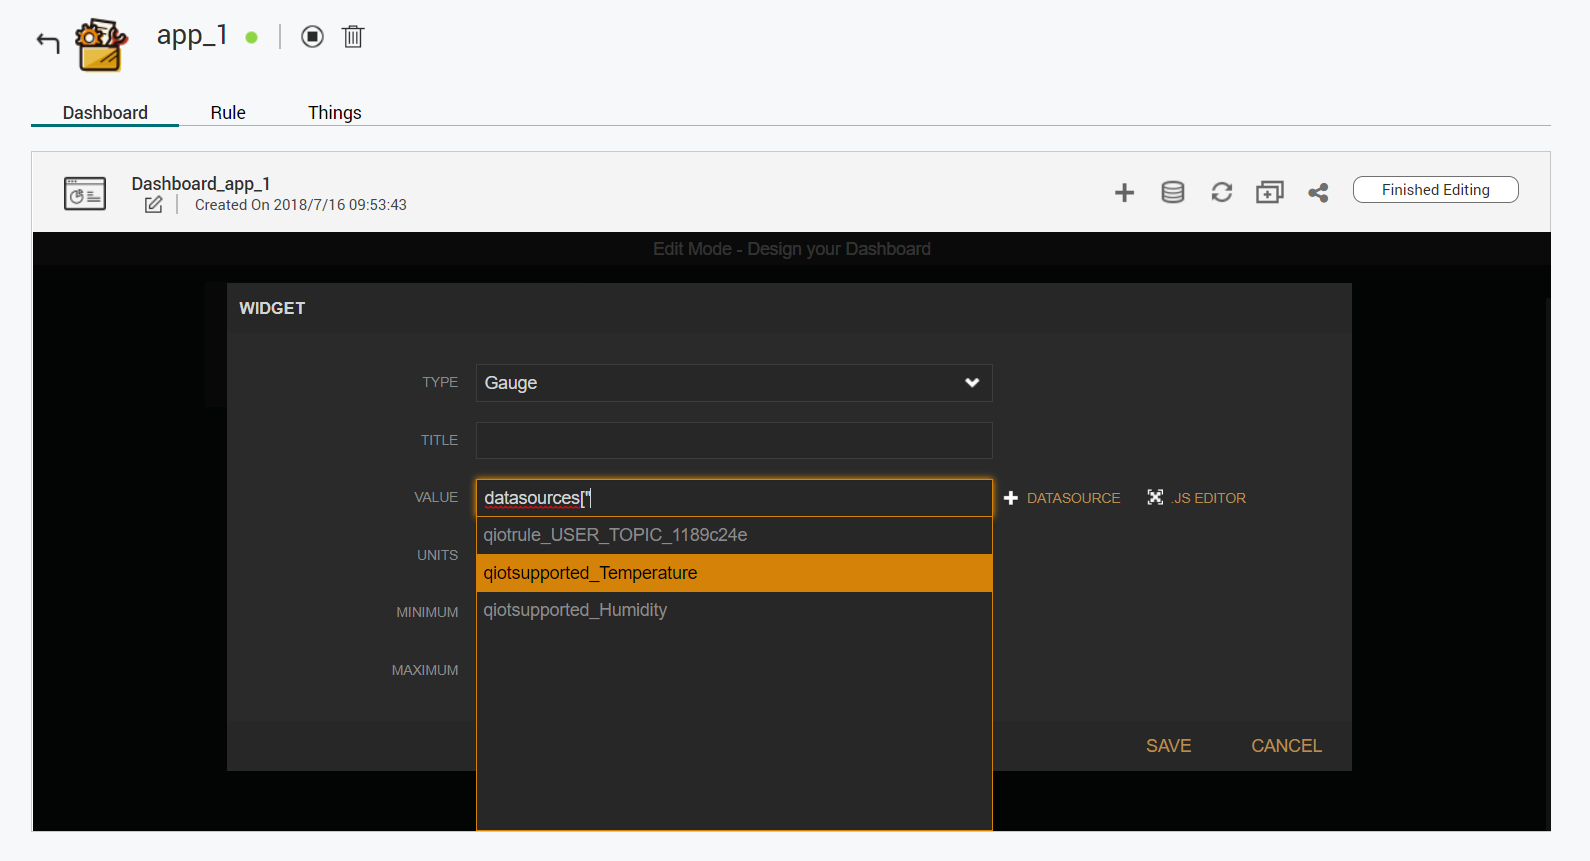
- Choose the resource name of the assigned topic and choose "Value".
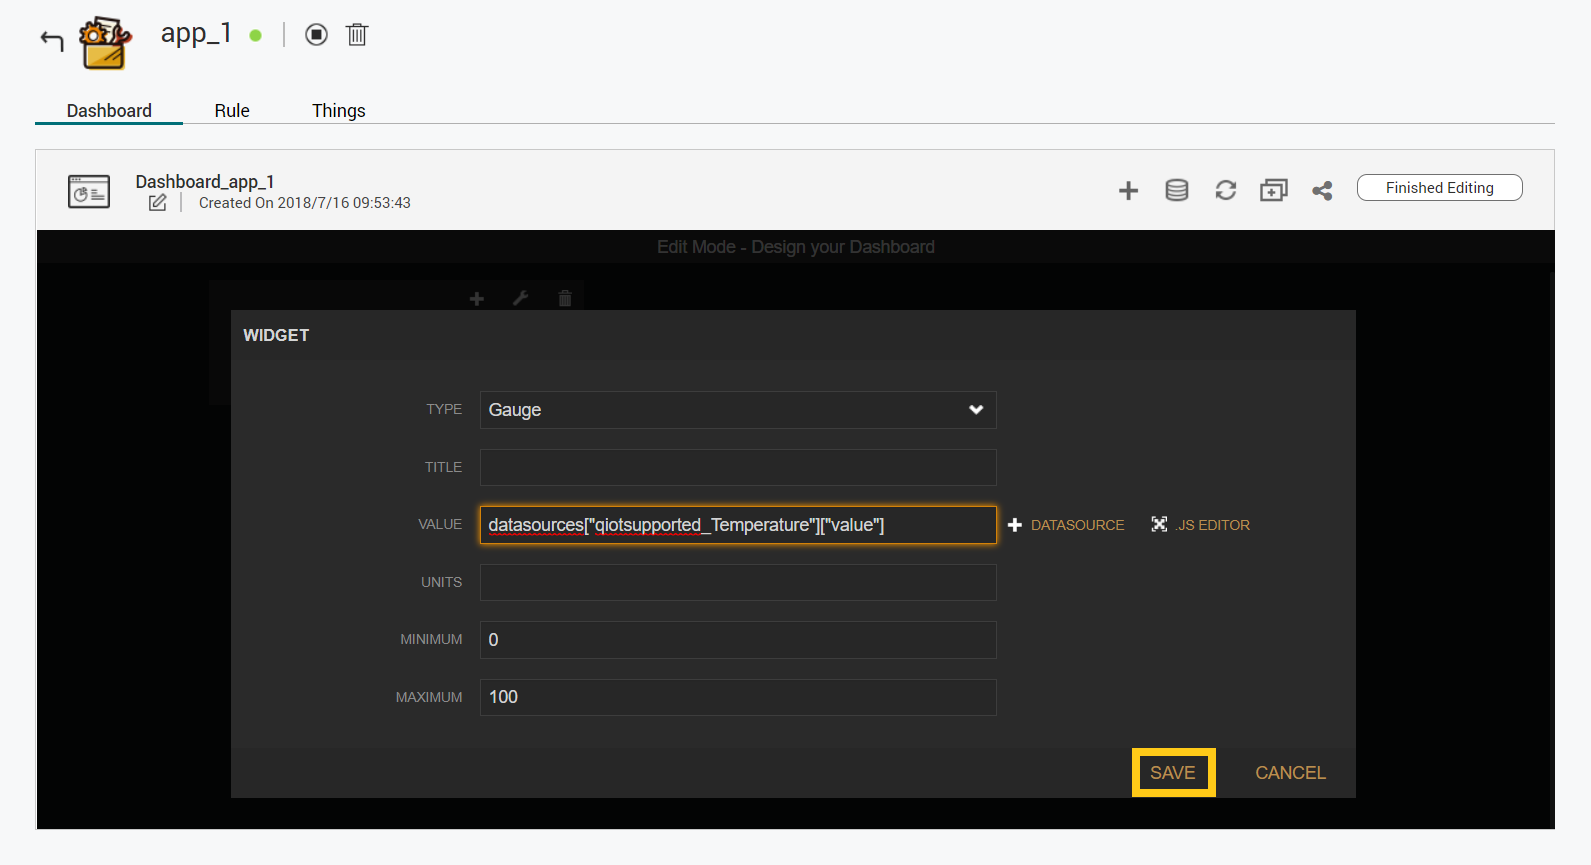
- Click "Save" and the widget will be created.
- Click "Edit".
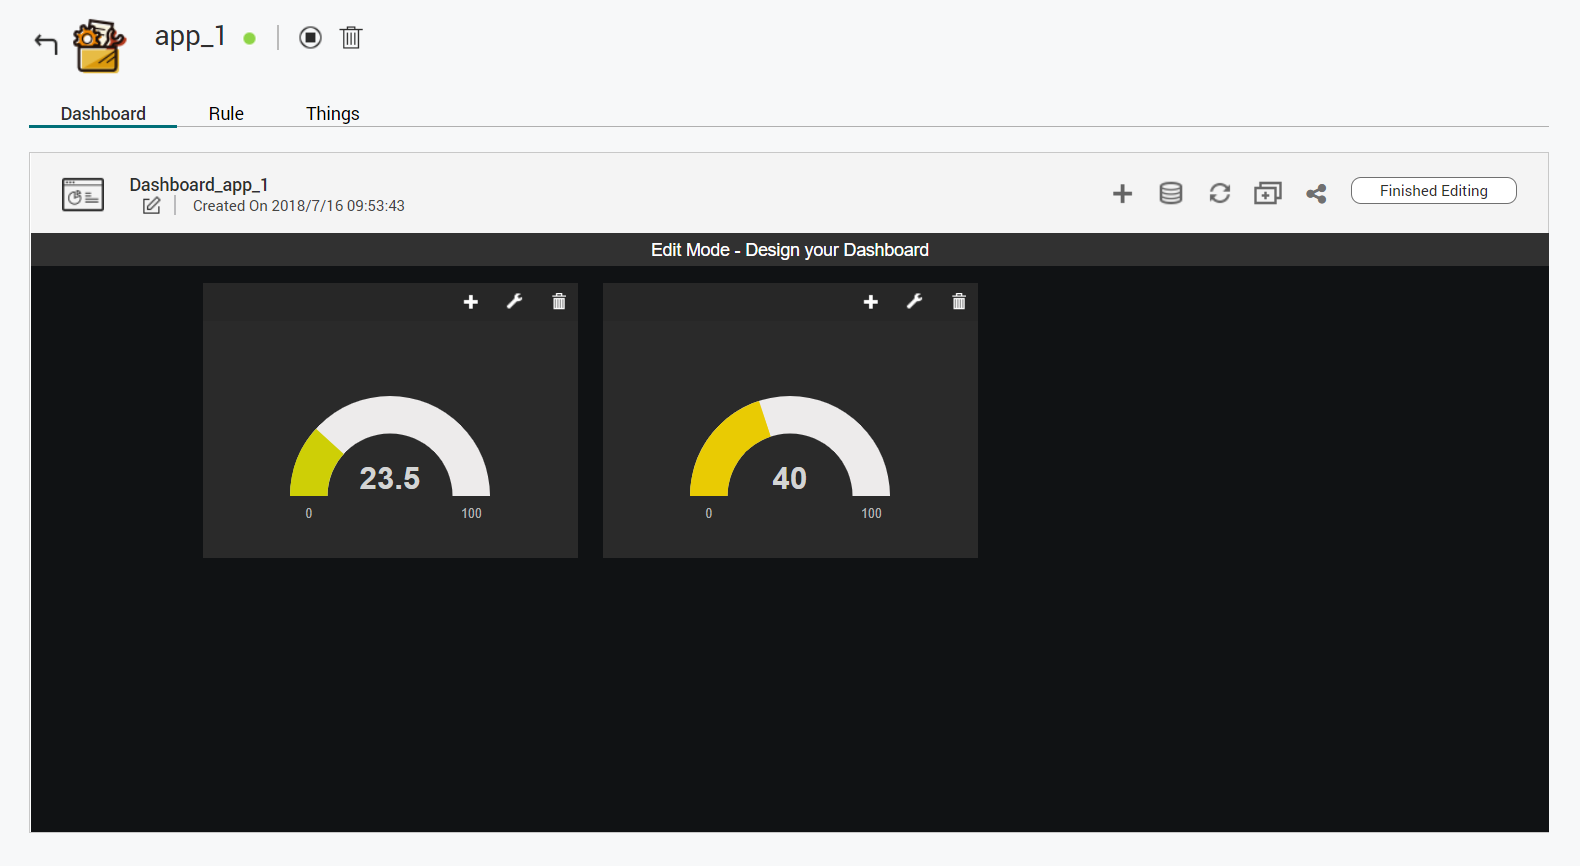
- Add the dashboard of both temperature and humidity, and you can see the result as following: