


How Does W5500 Carry OEE Telemetry from ESP32 to a FastAPI Dashboard?
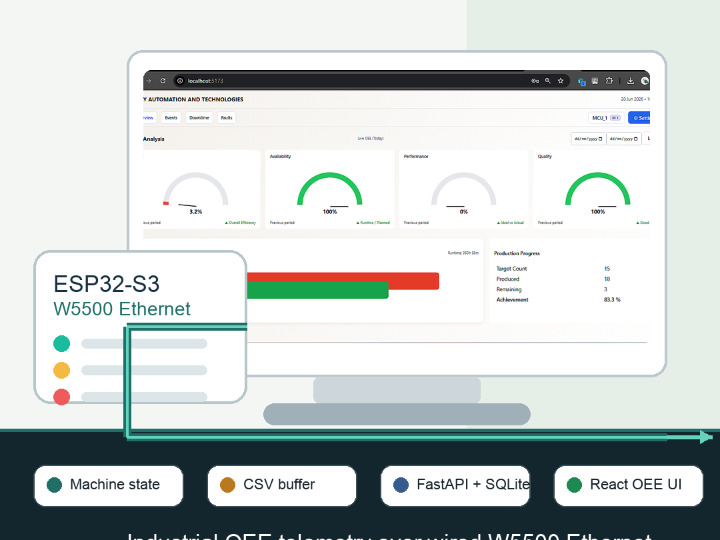
OEE_Public uses ESP32-S3, W5500 Ethernet, SD logging, FastAPI, SQLite, and React to move factory machine states into an OEE dashboard.
WIZnet - W5500
x 1

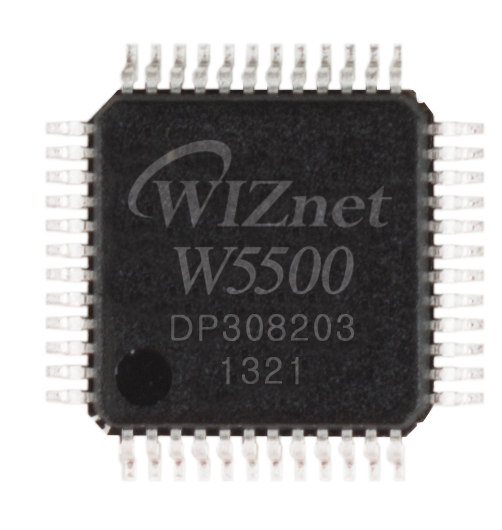
W5500 SPI Ethernet controller used by the ESP32/ESP32-S3 logger to move machine-state and CSV telemetry to the FastAPI OEE backend.
Overview
Ramasamy is a GitHub maker whose public profile focuses on embedded systems, ESP32, STM32, industrial automation, Python, and FastAPI. The OEE_Public repository was created and pushed on June 29, 2026, and documents a full-stack industrial OEE monitoring system built around an ESP32/ESP32-S3 edge logger, WIZnet W5500 Ethernet, a FastAPI backend, SQLite storage, and a React dashboard.
The practical problem is familiar in factory monitoring: a machine changes between RUN, IDLE, and FAULT states, but those state changes need to become reliable time-stamped data for dashboards and historical analysis. In this repository, the ESP32 side reads machine inputs, uses a PCF85063A RTC for time context, buffers data to a MicroSD card, and sends events or CSV files over a W5500 wired Ethernet link.
For WIZnet readers, the key point is that the W5500 is the wired telemetry boundary between the factory edge node and the host OEE software. The backend and dashboard do the OEE analysis; the W5500 gives the edge logger a source-backed Ethernet route to the server.
WIZnet role: W5500 carries machine-state and CSV telemetry from the ESP32 logger to the FastAPI backend. It is not the dashboard engine, the database, or an AI processor.
What OEE Means Here
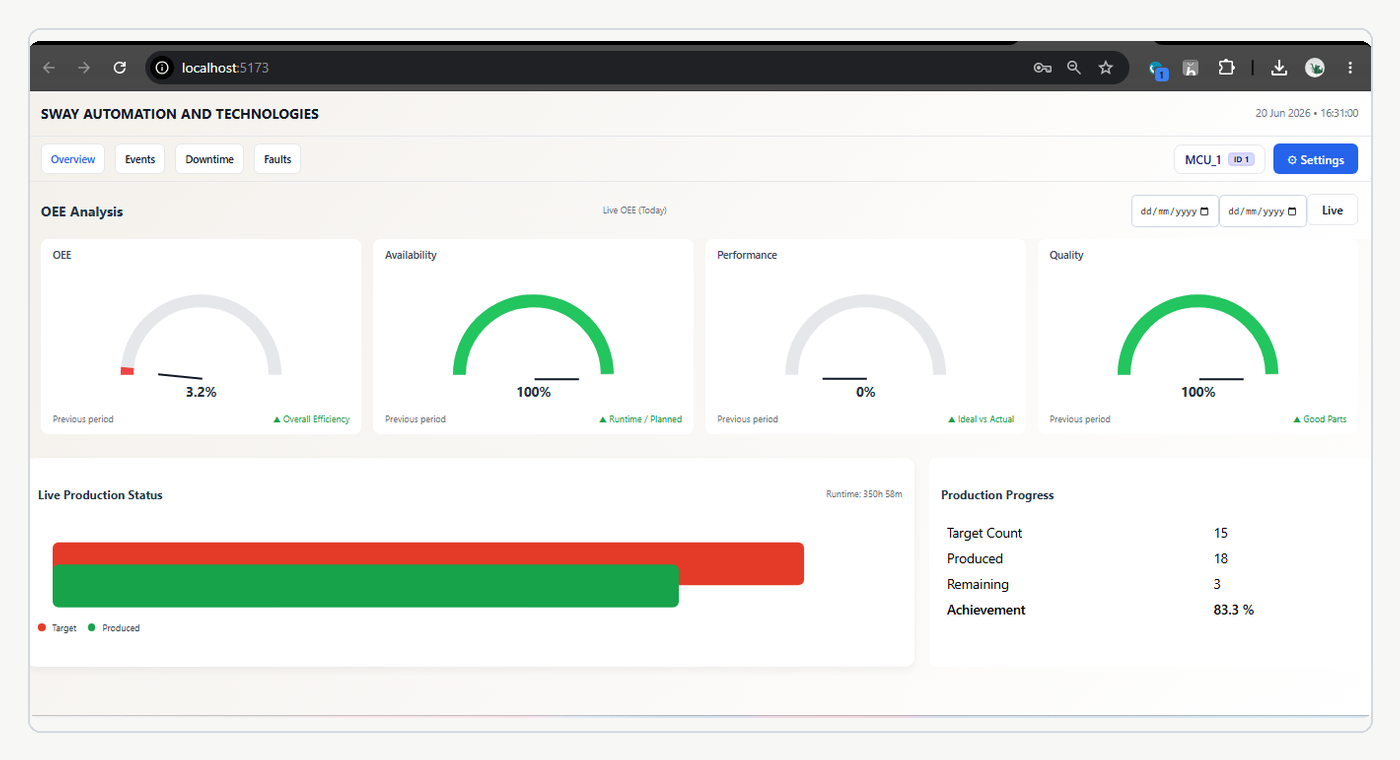
OEE means Overall Equipment Effectiveness. In manufacturing dashboards, it is commonly understood through three factors: Availability, Performance, and Quality. The source uses that same operating idea, with the dashboard showing OEE, availability, performance, quality, production progress, target count, produced count, and remaining count.
The inspected implementation is ESP-IDF C firmware plus a Python FastAPI backend and a React frontend. The README's future-improvement note about machine-learning quality classification is outside the current telemetry path, so the present source is best read as an OEE data-collection and dashboard reference.
System Configuration
The project is organized into three layers.
- The hardware layer is an ESP32 or ESP32-S3 logger. The docs list W5500 SPI Ethernet, a PCF85063A I2C RTC, a MicroSD card interface, and relay or optocoupler-style machine inputs.
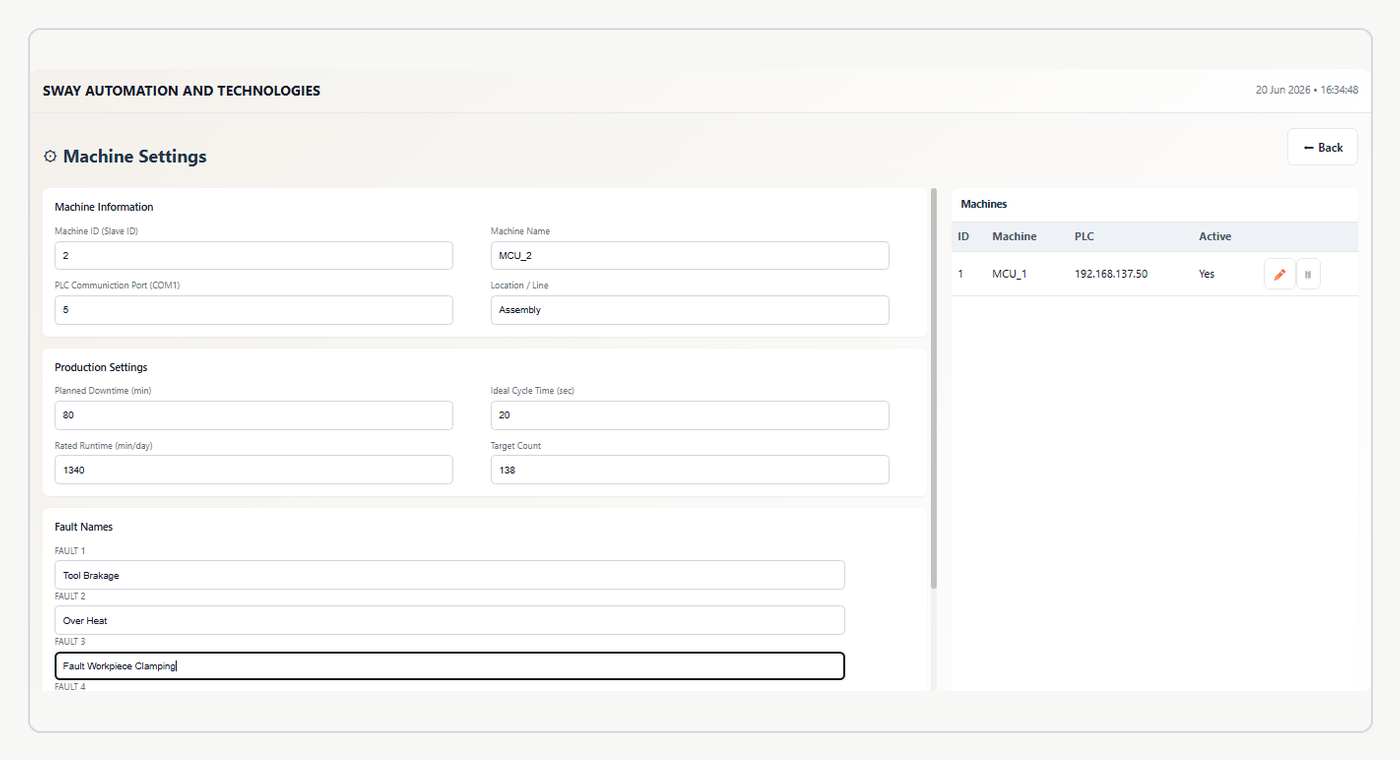
- The backend layer is a Python FastAPI service with SQLite. It includes API routes for live OEE, historical OEE, machine state updates, machine errors, CSV upload, and demo simulation.
- The frontend layer is a Vite + React dashboard using Recharts for OEE gauges, production charts, events, faults, downtime, and settings.
The repository also includes a demo mode. The backend can seed historical data and simulate machine states, which makes the dashboard inspectable even without ESP32 hardware connected.
Architecture and Data Flow
At the source level, the data path is straightforward. Machine inputs become local state on the ESP32, the RTC and MicroSD side preserve timing and outage tolerance, W5500 carries HTTP traffic over wired Ethernet, FastAPI receives or polls the data, SQLite stores runtime and event records, and React presents the OEE dashboard.
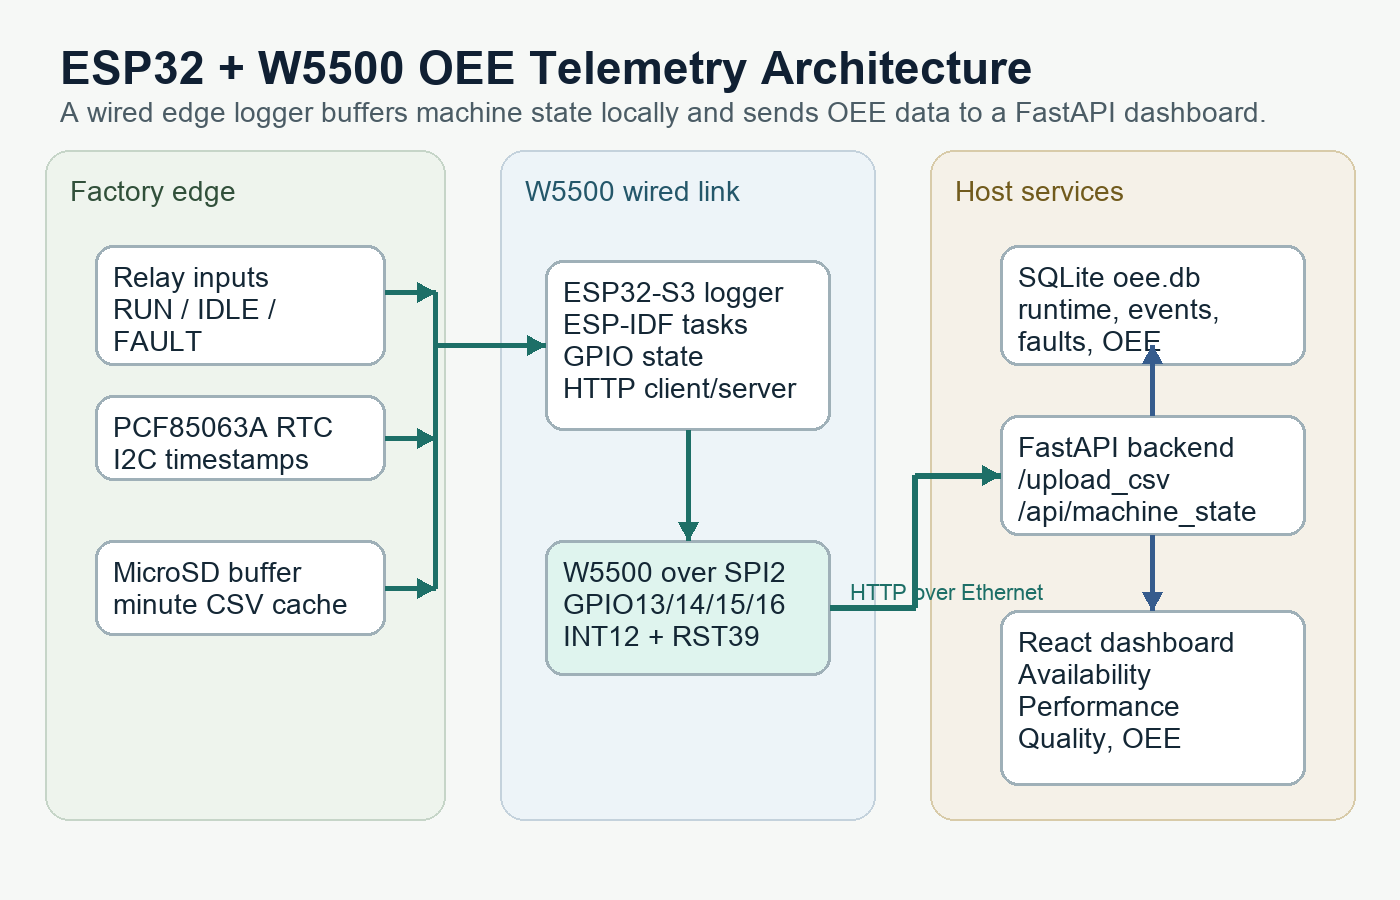
The firmware side exposes and consumes HTTP-style interfaces. The communication document describes state-change pushes to /api/machine_state, error reports to /api/machine_error, CSV uploads to /upload_csv, backend polling from /last_minute, and demo-mode simulation when hardware is not present. This is useful because it separates the edge logger from the dashboard: the ESP32 does time-sensitive collection and buffering, while the host software handles database and UI work.
Role of the WIZnet Chip
The W5500 evidence is not just a README line. In firmware/main/main.c, the code defines a W5500 SPI pin map and initializes the ESP-IDF Ethernet driver with W5500-specific APIs. The source uses ETH_W5500_DEFAULT_CONFIG, esp_eth_mac_new_w5500, esp_eth_phy_new_w5500, static IP setup, and esp_eth_start.
The documented W5500 pin path is:
- MOSI: GPIO13
- MISO: GPIO14
- SCLK: GPIO15
- CS/SCS: GPIO16
- INT/INTn: GPIO12
- RST/RSTn: GPIO39
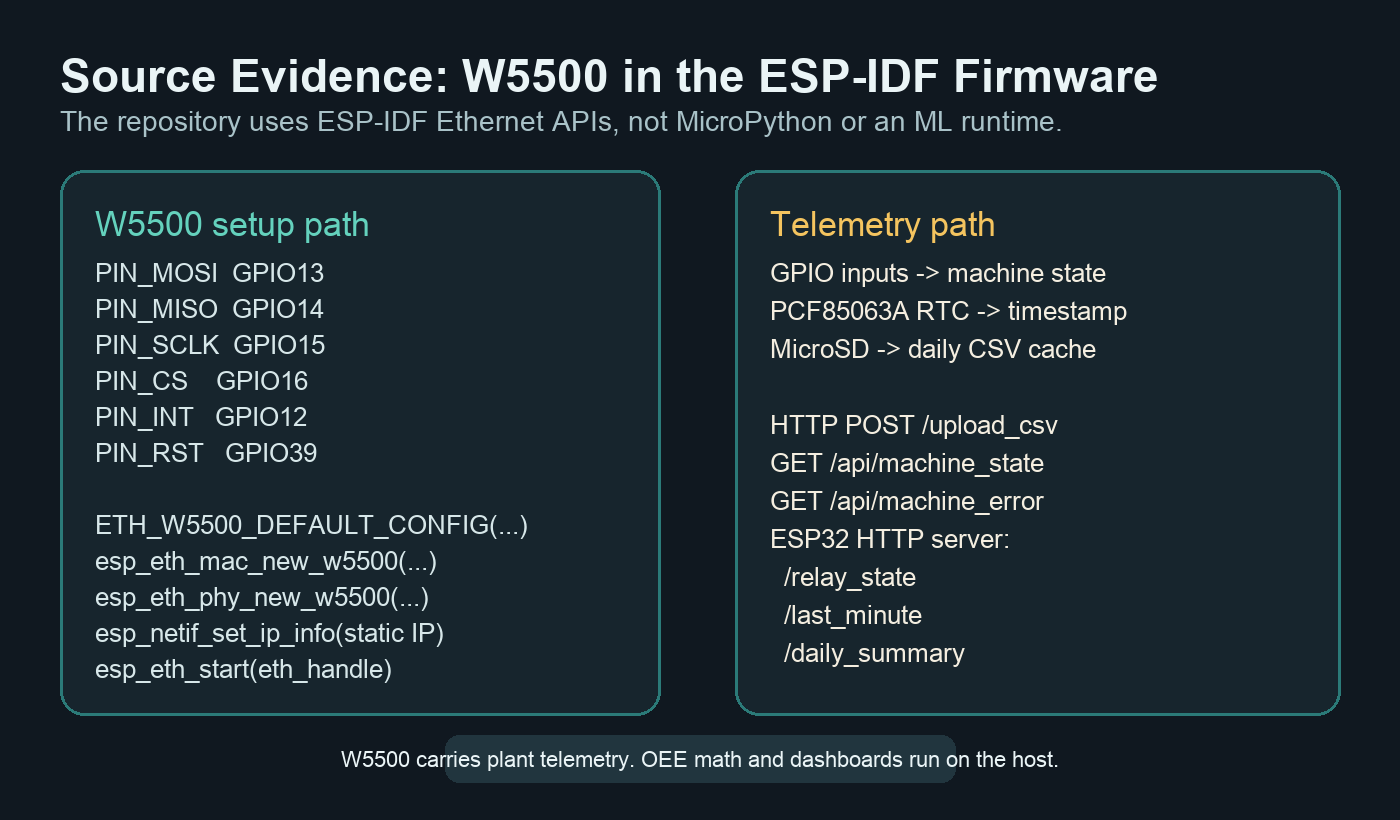
Source evidence: The firmware configures W5500 through ESP-IDF Ethernet APIs and uses HTTP client/server code to exchange CSV files, state changes, and summary values with the backend.
This makes the W5500 role specific: it is the wired Ethernet path that connects the shop-floor logger to the software stack. OEE math, simulator logic, SQLite records, and React charts live on the host side; the W5500 keeps the embedded side connected to that host path.
Backend, Dashboard, and Demo Mode
The Python backend has two important jobs. First, it serves API endpoints used by the React UI, such as live OEE and historical OEE. Second, it provides a simulator path that initializes the database and creates 30 days of historical machine data for local evaluation.
This makes the repository more than a one-file embedded demo. A reader can inspect:
backend/main.py, which starts the simulator and Uvicorn server threads.backend/mcu_run.py, which initializes SQLite tables and seeds demo data.backend/api.py, which exposes live OEE, history, machine-state, CSV upload, and configuration routes.frontend/package.json, which shows the React, Vite, and Recharts frontend stack.
The source also has an important boundary: the live OEE values are demo-oriented and include fixed quality values in backend code. Treat this as an OEE telemetry reference and dashboard prototype, not as a certified manufacturing analytics product.
Where It Fits - Value and Limits
This project is useful for WIZnet Maker because it shows a repeatable pattern: factory signal capture -> W5500 wired upload -> FastAPI storage -> React OEE dashboard. That pattern is relevant to production counters, downtime trackers, simple machine monitoring, lab OEE demos, and industrial education projects.
It is also honest to keep the limits visible:
- The repo has source screenshots, but no public hardware photo showing the actual W5500 module.
- The README says MIT, but there is no LICENSE file and the GitHub license field is null.
- Some portfolio placeholders remain, including
YOUR_ADMIN_PASSWORD, demo IP placeholders, and a README author placeholder. - The ESP-IDF firmware was not built in this review environment because hardware and toolchain setup are required.
- Quality classification is listed as a future improvement, so the current public source should not be treated as a validated quality-inspection model or dataset release.
Source limit: This should be read as a source-rich portfolio/reference project for OEE telemetry architecture, not as a production-certified OEE appliance.
Related WIZnet Maker Projects
EnergyMonitoringSoftware is the closest dashboard-style neighbor. It also uses W5500 in an industrial telemetry context, but its application is mixed-brand power meter monitoring rather than OEE machine-state tracking.
Tools Monorepo - P1AM DCS/SCADA Control System is related because it connects industrial control, FastAPI middleware, React HMI, SQLite logging, and W5500 Ethernet. The difference is that it centers on a P1AM DCS/SCADA-style controller, while OEE_Public centers on ESP32 machine-state logging and OEE metrics.
slmp4e connect cpp minimal is a good protocol-side follow-up. It is not an OEE dashboard, but it shows how factory communication libraries and W5500 Ethernet can fit into MCU-based industrial systems.
Source-Backed Summary
OEE_Public is a useful WIZnet Maker reference because it connects an embedded ESP32 logger to a real dashboard stack. W5500 handles the wired Ethernet route, the ESP32 firmware handles local machine-state collection and buffering, and the backend/frontend pair turns that data into OEE-style visibility. The strongest next step for the author would be a LICENSE file, real hardware photos, and reproducible firmware build notes.
FAQ
Q. How does this ESP32 OEE monitoring system collect machine data? The ESP32/ESP32-S3 logger reads machine-state inputs such as RUN, IDLE, and FAULT, adds local timing context, buffers minute CSV data to MicroSD, and sends telemetry to the backend for OEE visualization.
Q. Why use W5500 Ethernet instead of a Wi-Fi-only OEE logger? In this source, W5500 gives the edge logger a wired Ethernet path for HTTP uploads and polling. That is useful for factory-style monitoring where the dashboard depends on steady machine-state data rather than occasional manual exports.
Q. What software stack receives the W5500 telemetry? A Python FastAPI backend receives machine-state updates, error reports, CSV uploads, and dashboard polling requests. SQLite stores runtime and event data, while the React frontend displays OEE, availability, performance, quality, production, downtime, and fault views.
Q. Can the OEE dashboard be tested without the ESP32 hardware? Yes. The repository includes a backend simulator/demo path that initializes SQLite and seeds historical machine data, so readers can inspect the dashboard workflow before validating the ESP32 and W5500 hardware path.
Q. What should be added before using this as a production OEE system? The public source would need reproducible ESP-IDF build notes, real hardware photos, deployment logs, calibration or quality-metric validation, and a dedicated LICENSE file before it could be evaluated as a production-ready industrial package.
한국어 (Korean)
개요
Ramasamy는 GitHub 공개 프로필에서 embedded systems, ESP32, STM32, industrial automation, Python, FastAPI를 다루는 제작자로 소개되어 있습니다. OEE_Public 저장소는 2026년 6월 29일 생성 및 push된 프로젝트로, ESP32/ESP32-S3 edge logger, WIZnet W5500 Ethernet, FastAPI backend, SQLite, React dashboard를 연결한 산업용 OEE 모니터링 구조를 보여줍니다.
이 프로젝트의 문제의식은 공장 설비의 RUN, IDLE, FAULT 상태를 신뢰성 있게 수집해 대시보드와 이력 분석으로 보내는 것입니다. ESP32 쪽은 설비 입력을 읽고, PCF85063A RTC로 시간을 맞추고, MicroSD에 데이터를 버퍼링하며, W5500 유선 Ethernet을 통해 이벤트와 CSV 데이터를 보냅니다.
WIZnet 관점에서 핵심은 W5500이 설비 edge logger와 host OEE software 사이의 유선 telemetry 경계라는 점입니다. OEE 계산과 대시보드는 host software가 담당하고, W5500은 embedded node가 서버로 가는 Ethernet 경로를 제공합니다.
WIZnet 역할: W5500은 ESP32 logger에서 FastAPI backend로 machine-state와 CSV telemetry를 전달합니다. 대시보드 엔진이나 데이터베이스, AI processor가 아니라 유선 Ethernet 경로입니다.
여기서 OEE가 의미하는 것
OEE는 Overall Equipment Effectiveness, 즉 설비종합효율을 뜻합니다. 일반적으로 Availability, Performance, Quality 세 요소를 통해 설비 효율을 봅니다. 이 저장소도 같은 관점으로 OEE, availability, performance, quality, production progress, target count, produced count, remaining count를 화면에 표시합니다.
현재 확인된 구현은 ESP-IDF C firmware와 Python FastAPI backend, React frontend입니다. README의 machine-learning quality classification 언급은 future improvement 항목이므로, 현재 공개 소스는 OEE data collection과 dashboard reference로 보는 것이 맞습니다.
시스템 구성
프로젝트는 세 계층으로 나뉩니다.
- Hardware layer는 ESP32 또는 ESP32-S3 logger입니다. 문서에는 W5500 SPI Ethernet, PCF85063A I2C RTC, MicroSD card interface, relay 또는 optocoupler 방식의 machine input이 나옵니다.
- Backend layer는 Python FastAPI와 SQLite입니다. live OEE, historical OEE, machine state, machine error, CSV upload, demo simulation API가 있습니다.
- Frontend layer는 Vite + React dashboard이며 Recharts로 OEE gauge, production chart, event, fault, downtime, settings 화면을 보여줍니다.
이 저장소에는 demo mode도 있습니다. 백엔드가 이력 데이터를 seed하고 설비 상태를 시뮬레이션할 수 있어서, 실제 ESP32 하드웨어 없이도 dashboard를 확인할 수 있습니다.
아키텍처와 데이터 흐름
소스 기준 데이터 흐름은 명확합니다. 설비 입력은 ESP32의 local state가 되고, RTC와 MicroSD가 시간과 outage tolerance를 보완합니다. W5500은 HTTP traffic을 유선 Ethernet으로 전달하고, FastAPI가 데이터를 받거나 polling하며, SQLite가 runtime/event 기록을 저장하고, React가 OEE dashboard를 표시합니다.
communication 문서는 /api/machine_state, /api/machine_error, /upload_csv, /last_minute 같은 경로를 설명합니다. 이 구조는 edge logger와 dashboard를 분리한다는 점에서 유용합니다. ESP32는 time-sensitive collection과 buffering을 담당하고, host software는 database와 UI를 담당합니다.
WIZnet 칩의 역할
W5500 근거는 README 문장에 그치지 않습니다. firmware/main/main.c에는 W5500 SPI pin map이 있고, ESP-IDF Ethernet driver를 W5500 전용 API로 초기화합니다. 코드에는 ETH_W5500_DEFAULT_CONFIG, esp_eth_mac_new_w5500, esp_eth_phy_new_w5500, static IP setup, esp_eth_start가 들어 있습니다.
문서와 코드 기준 W5500 pin path는 다음과 같습니다.
- MOSI: GPIO13
- MISO: GPIO14
- SCLK: GPIO15
- CS/SCS: GPIO16
- INT/INTn: GPIO12
- RST/RSTn: GPIO39
소스 근거: 펌웨어는 ESP-IDF Ethernet API로 W5500을 설정하고, HTTP client/server 코드로 CSV 파일, state change, summary 값을 backend와 교환합니다.
즉 W5500의 역할은 구체적입니다. shop-floor logger와 software stack을 연결하는 유선 Ethernet 경로입니다. OEE 계산, simulator logic, SQLite record, React chart는 host 쪽에 있고, W5500은 embedded side를 그 host path에 연결합니다.
Backend, Dashboard, Demo Mode
Python backend는 두 가지 역할을 합니다. 첫째, React UI가 사용하는 live OEE와 historical OEE API를 제공합니다. 둘째, database를 초기화하고 30일치 simulated machine data를 넣는 simulator path를 제공합니다.
따라서 이 저장소는 단일 embedded demo보다 더 큽니다. 독자는 다음 파일들을 확인할 수 있습니다.
backend/main.py: simulator와 Uvicorn server thread를 시작합니다.backend/mcu_run.py: SQLite table을 만들고 demo data를 seed합니다.backend/api.py: live OEE, history, machine-state, CSV upload, configuration API를 제공합니다.frontend/package.json: React, Vite, Recharts frontend stack을 보여줍니다.
다만 live OEE 값은 demo-oriented이며 backend code에 고정 quality 값이 들어 있습니다. 이 프로젝트는 certified manufacturing analytics 제품이라기보다 OEE telemetry reference와 dashboard prototype으로 보는 것이 맞습니다.
적용 가치와 한계
이 프로젝트는 WIZnet Maker 관점에서 반복 가능한 패턴을 보여줍니다. factory signal capture -> W5500 wired upload -> FastAPI storage -> React OEE dashboard 흐름입니다. 생산 카운터, downtime tracker, 간단한 machine monitoring, lab OEE demo, industrial education project에 응용할 수 있습니다.
한계도 명확히 봐야 합니다.
- 저장소에는 source screenshot은 있지만 실제 W5500 module을 보여주는 hardware photo는 없습니다.
- README에는 MIT라고 되어 있지만 LICENSE 파일은 없고 GitHub license field도 null입니다.
YOUR_ADMIN_PASSWORD, demo IP placeholder, README author placeholder가 남아 있습니다.- 이 리뷰 환경에서는 ESP-IDF firmware build를 실행하지 않았습니다. toolchain과 hardware setup이 필요합니다.
- Quality classification은 future improvement로만 제시되어 있으므로, 현재 공개 소스를 검증된 quality-inspection model이나 dataset release로 보면 안 됩니다.
소스 한계: 이 글은 OEE telemetry architecture를 보여주는 source-rich portfolio/reference project로 보아야 하며, production-certified OEE appliance로 보면 안 됩니다.
관련 WIZnet Maker 프로젝트
EnergyMonitoringSoftware는 dashboard-style telemetry 관점에서 가장 가까운 관련 글입니다. 이 글도 W5500을 industrial telemetry 문맥에서 사용하지만, 대상은 mixed-brand power meter monitoring이고 OEE_Public은 machine-state tracking과 OEE metric에 초점을 둡니다.
Tools Monorepo - P1AM DCS/SCADA Control System은 industrial control, FastAPI middleware, React HMI, SQLite logging, W5500 Ethernet이 함께 나온다는 점에서 연결됩니다. 차이는 해당 글이 P1AM DCS/SCADA-style controller와 safety interlock 중심이고, OEE_Public은 ESP32 machine-state logging과 OEE dashboard 중심이라는 점입니다.
slmp4e connect cpp minimal은 protocol-side follow-up으로 좋습니다. OEE dashboard는 아니지만, MCU 기반 industrial system에서 factory communication library와 W5500 Ethernet이 어떻게 연결될 수 있는지 보여줍니다.
소스 기반 요약
OEE_Public은 embedded ESP32 logger와 dashboard stack을 연결한다는 점에서 WIZnet Maker에 적합한 reference입니다. W5500은 유선 Ethernet route를 담당하고, ESP32 firmware는 local machine-state collection과 buffering을 처리하며, backend/frontend는 그 데이터를 OEE-style visibility로 바꿉니다. 저자가 LICENSE 파일, 실제 hardware photo, reproducible firmware build note를 추가하면 더 강한 reference가 될 수 있습니다.
FAQ
Q. 이 ESP32 OEE monitoring system은 설비 데이터를 어떻게 수집하나요? ESP32/ESP32-S3 logger가 RUN, IDLE, FAULT 같은 machine-state input을 읽고, 시간 정보를 붙이고, minute CSV 데이터를 MicroSD에 버퍼링한 뒤 backend로 telemetry를 보냅니다.
Q. Wi-Fi-only OEE logger 대신 W5500 Ethernet을 쓰는 이유는 무엇인가요? 이 소스에서 W5500은 HTTP upload와 polling을 위한 유선 Ethernet 경로를 제공합니다. 수동 export가 아니라 지속적인 machine-state data가 필요한 factory monitoring 흐름에 적합합니다.
Q. W5500 telemetry를 받는 software stack은 무엇인가요? Python FastAPI backend가 machine-state update, error report, CSV upload, dashboard polling request를 처리합니다. SQLite가 runtime/event 데이터를 저장하고, React frontend가 OEE, availability, performance, quality, production, downtime, fault view를 표시합니다.
Q. ESP32 hardware 없이 OEE dashboard를 테스트할 수 있나요? 가능합니다. 저장소에는 SQLite를 초기화하고 이력 machine data를 넣는 backend simulator/demo path가 있어, ESP32와 W5500 hardware path를 검증하기 전에도 dashboard workflow를 확인할 수 있습니다.
Q. production OEE system으로 쓰려면 무엇이 더 필요하나요? reproducible ESP-IDF build note, 실제 hardware photo, deployment log, calibration 또는 quality-metric validation, 별도 LICENSE file이 보강되어야 production-ready industrial package로 평가할 수 있습니다.
-
Original GitHub repository
Original source repository for the ESP32, W5500, FastAPI, SQLite, and React OEE monitoring system.

-
Architecture overview
System architecture document describing ESP32 hardware, W5500 Ethernet, FastAPI, SQLite, and React layers.
-
Hardware wiring and W5500 pinout
Hardware document listing ESP32-S3, W5500 SPI pins, RTC, MicroSD, and machine input wiring.
-
Communication protocols
Protocol document covering machine-state HTTP events, CSV uploads, backend polling, and demo mode.
-
ESP-IDF firmware main.c
Firmware file containing W5500 Ethernet initialization, HTTP upload, and local ESP32 API handlers.
-
FastAPI backend api.py
Backend file with OEE live/history endpoints, CSV upload handling, and machine-state APIs.
-
Database schema documentation
SQLite schema documentation for runtime, event, fault, and OEE dashboard data.


