


How Does a W5500 Wired ESP32 Monitor 3-Phase Power at a BMKG Geophysics Station?
A peer-reviewed 2026 paper wires an ESP32, three PZEM-004T sensors, and a W5500 Ethernet module into the BMKG Sleman station LAN to log 3-phase kWh in MySQL.
WIZnet - W5500
x 1

Ethernet module on the ESP32 SPI bus, the only network interface of the deployed instrument. Sends all 3-phase measurements over UTP cable into the BMKG Sleman station LAN.
A Weather Agency Station That Meters Its Own Building
Nine Indonesian authors built a 3-phase electricity monitor: eight undergraduates in the Applied Instrumentation program at STMKG, the state college of meteorology, climatology, and geophysics in Tangerang, and Arif Kurniawan of Geophysics Station Class I Sleman, a BMKG field station in Yogyakarta. Their peer-reviewed paper in the Journal of Computation Physics and Earth Science (JoCPES, Vol. 5 No. 2, pages 137 to 144) documents a system that was not left on a lab bench. It was mounted on the station wall, wired into the office LAN, and checked against the utility company's own meter.
The abstract states the hardware in one sentence: "This system integrates a PZEM-004T energy sensor, an ESP32 microcontroller, a 16x2 Liquid Crystal Display, and a W5500 Ethernet module to acquire, process, and transmit real-time electrical parameters, including voltage, current, and kWh." The WIZnet W5500 is the only network interface in the installed design, carrying every measurement over cable to a MySQL server and a PHP dashboard.
The manuscript was received on December 31, 2025, accepted on March 2, 2026, and published online on March 19, 2026, in an issue dated February 2026. The article is open access under a CC BY-SA license, with DOI 10.63581/JoCPES.v5i2.02, and every figure and number in this post was checked against the journal PDF on August 28, 2026.
Why the Station Built It
The trigger was partly regulatory. Indonesia's Presidential Instruction Number 1 of 2025 ordered ministries and agencies to cut spending, with a national efficiency target of IDR 306.69 trillion, and BMKG units such as the Sleman station are obligated to contribute. Electricity is one of the few line items a small field station can actually influence.
The practical problem was more mundane. The station's PLN utility meter sits on a main panel far from the operational building, so staff had been recording kWh by walking to the panel and reading it every morning. The paper calls this routine time-consuming and notes that it slows down any load analysis or energy-saving decision. The design goal that follows is plain: record electricity usage automatically and put the numbers where everyone works.
What Sits Inside the IP65 Box
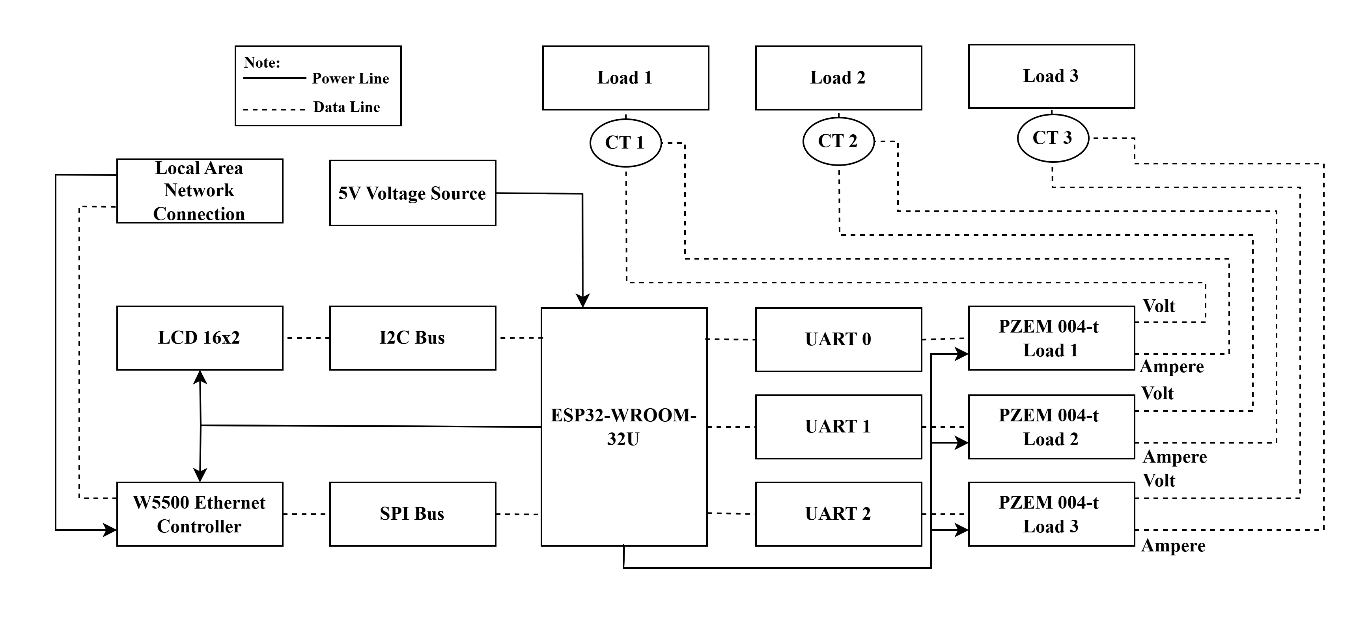
The instrument is built from commodity parts around an ESP32-WROOM-32U module. Each of the three load phases L1, L2, and L3 gets its own PZEM-004T energy sensor with a current transformer, and each sensor talks to the ESP32 over its own UART. A 16x2 character LCD on the I2C bus gives a local readout at the panel, and the W5500 module hangs off the SPI bus. Power comes from a 5V adapter, with the ESP32's onboard 3.3V regulator feeding the logic.
| Part | Bus to the ESP32 | Role in the system |
|---|---|---|
| PZEM-004T, 3 units | UART 0, 1, and 2 | Per-phase voltage, current, and kWh acquisition |
| W5500 Ethernet module | SPI | Sends every measurement into the station LAN |
| 16x2 character LCD | I2C | Local readout at the panel enclosure |
| Current transformers, 3 units | Via PZEM-004T | Non-invasive current sensing on L1, L2, L3 |
The firmware aggregates the three phases on the microcontroller before anything leaves the board. The combined voltage is the root of the sum of squared phase voltages, the combined current is an adaptive average that only counts phases carrying current, and total energy is the sum of the three per-phase kWh registers plus a recorded baseline. That adaptive current logic matters in practice because unbalanced loads and idle phases are normal in a small office installation.
How the W5500 Carries Data Across the Station LAN
Section 2.2 of the paper states that "the W5500 Ethernet module is connected via the SPI interface," and Section 2.3 describes the other end of the wire: the device is "physically connected using a UTP cable to a network switch installed in the Graha Building." From that switch the packets pass through the office's central router to a second switch in the Operational Room, and finally to a target PC with the static address 192.168.1.95. The instrument itself takes a dynamic address in the 192.168.1.x range.
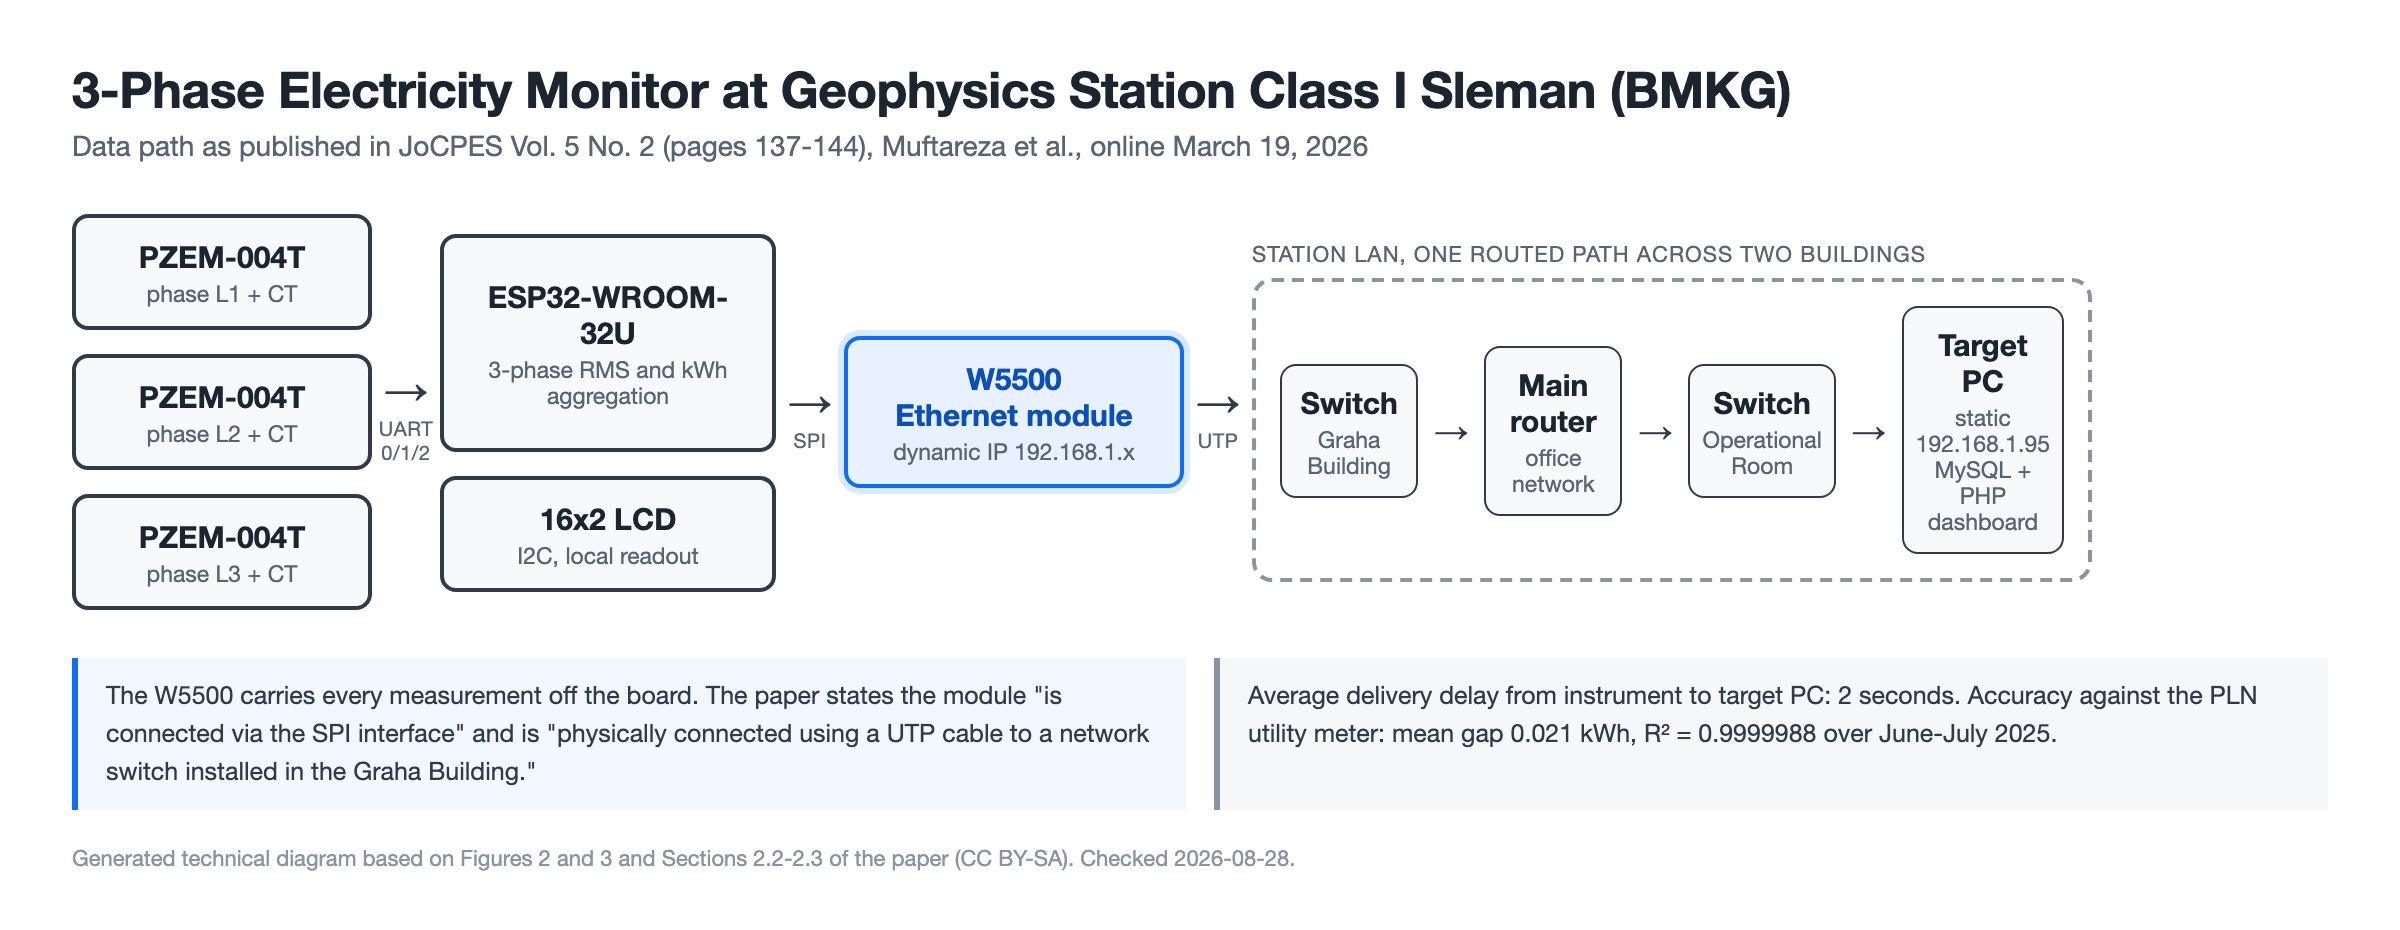
The paper does not argue wired against wireless. It simply states that "a local network topology is implemented to ensure stable data transmission to a MySQL-based database server," and the ESP32's built-in Wi-Fi appears only in the literature review, not in the installed design. What the deployment does demonstrate is a hardwired Ethernet chip fitting into existing government office infrastructure: two switches, one router, standard UTP cabling, and no new radio equipment or credentials.
Delivery over that path is quick and, more importantly, predictable. The paper reports that "the average data transmission delay from the research instrument to the target PC data receiver is only 2 seconds," giving the example of a reading scheduled for 12:00 arriving at 12:00:02.
On the Wall Since June 2025
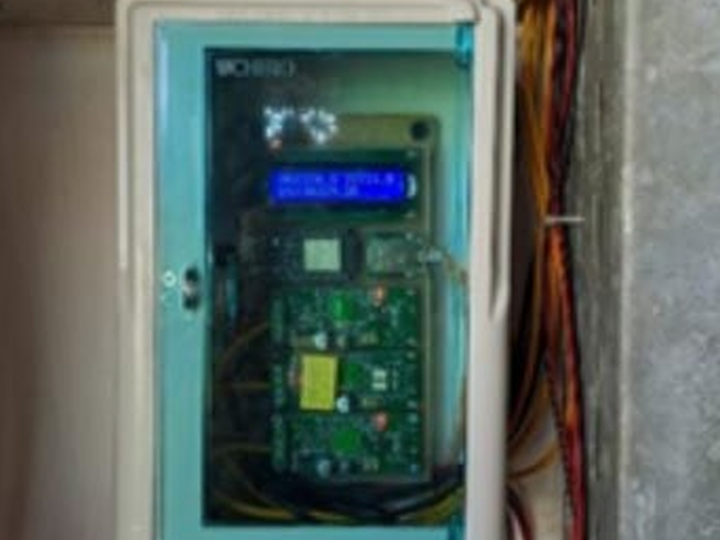
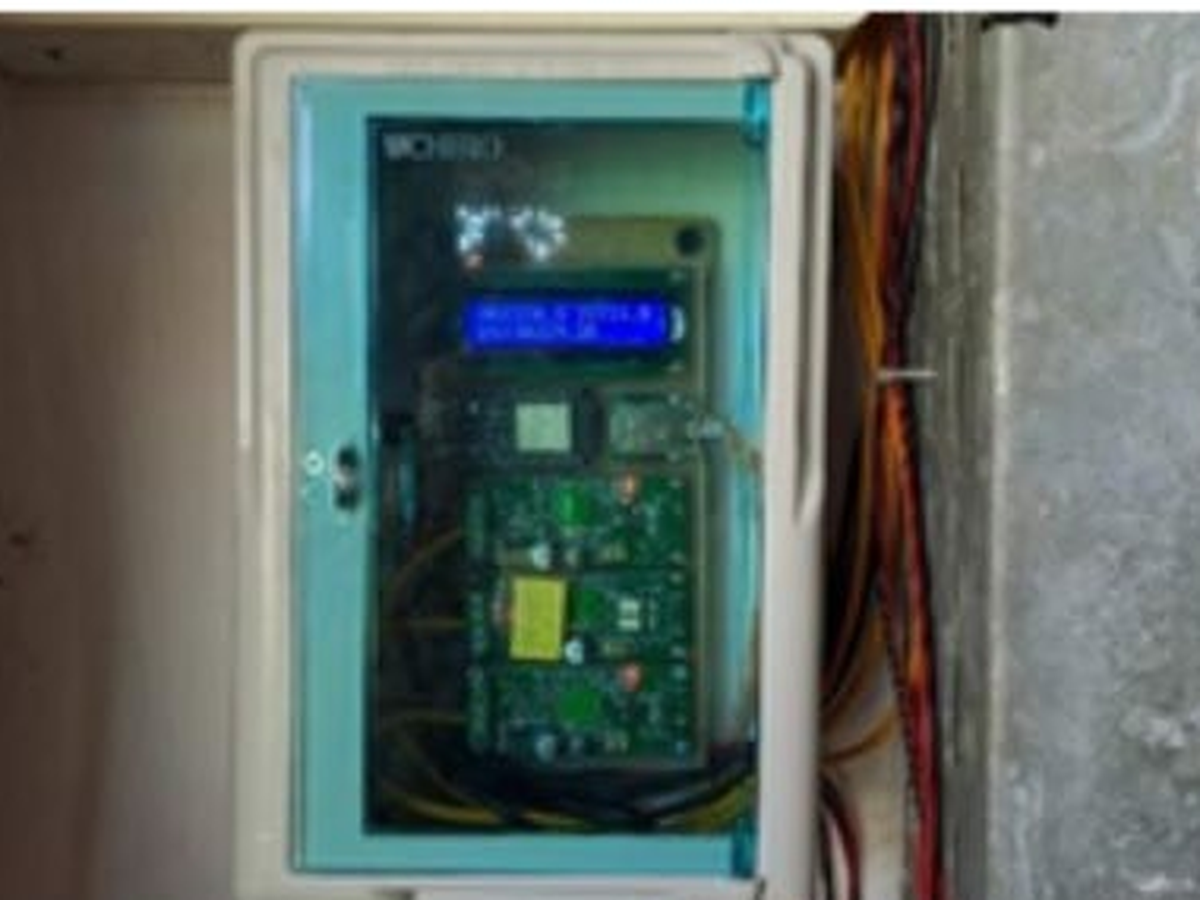
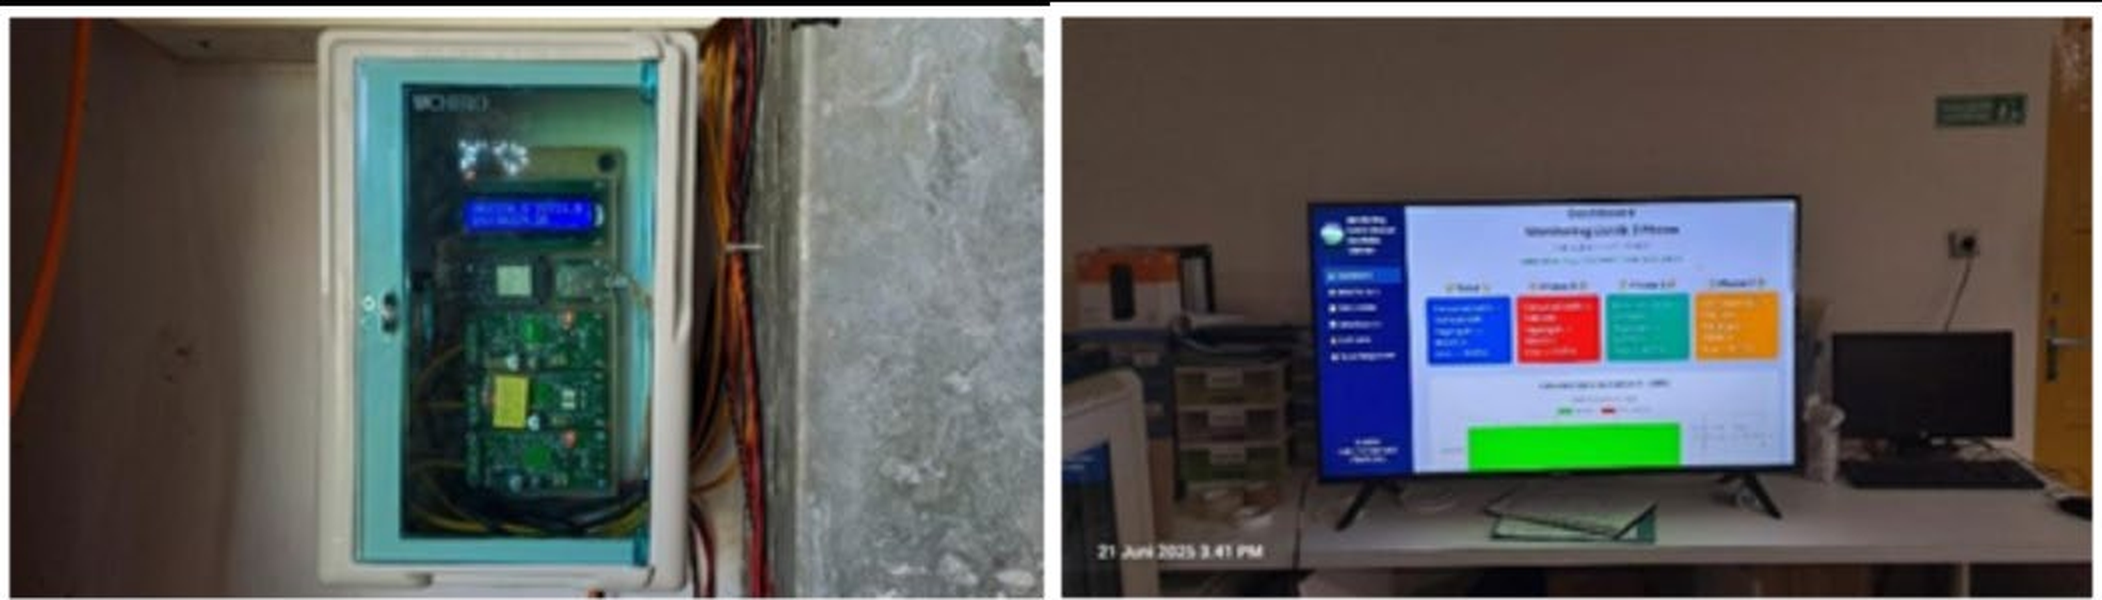
Deployment was staged: physical installation, software installation, then network configuration, with attention to occupational safety and electrical standards. All sensor and measurement connections live inside a waterproof and dustproof IP65 panel enclosure, which is the box visible in the photographs. The deployment photos in Figure 4 carry an on-image timestamp of June 21, 2025, with the dashboard shown running on a large TV screen in the station.
The Database and the Dashboard
On the receiving PC, a MySQL schema of eight tables structures the data: raw PZEM readings in data_kwh, hourly and daily and monthly aggregates in their own tables, a daily baseline table, and three tables for tariff data and the daily consumption threshold. Hourly usage is the difference between consecutive cumulative readings, days sum the hours, and months sum the days, so every level of the reporting stays consistent with the raw meter data.
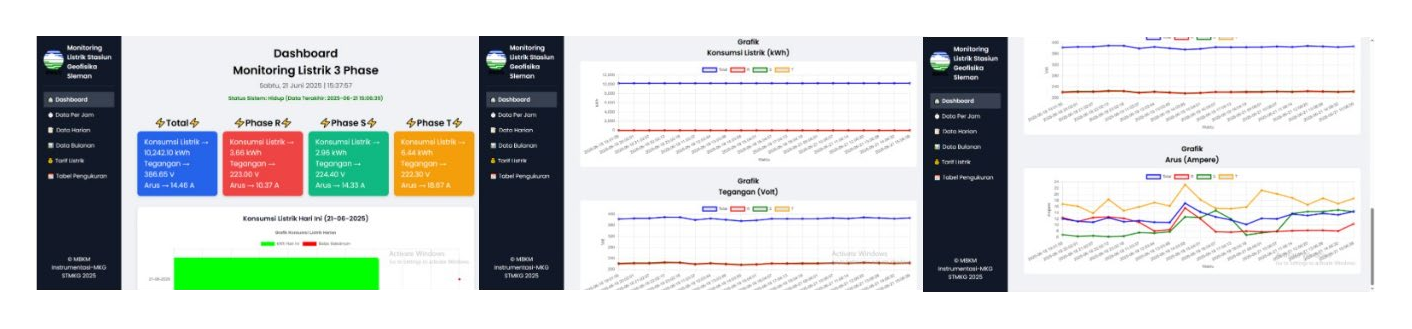
The web interface is written in HTML, CSS, JavaScript, and PHP, and the screenshots identify it as "Monitoring Listrik Stasiun Geofisika Sleman." Its footer credits an STMKG instrumentation program team with a 2025 date. The dashboard gives the station staff a set of concrete tools:
- Real-time cards for total and per-phase voltage, current, and kWh
- Line graphs of 3-phase voltage, current, and usage over time
- Hourly, daily, and monthly consumption pages with searchable tables
- A configurable daily kWh threshold with an on-screen alert when it is exceeded
- An electricity bill estimate in IDR, computed from usage and a stored government tariff table
- CSV export on every data page for reporting and archiving
How Close Is It to the Utility Meter?
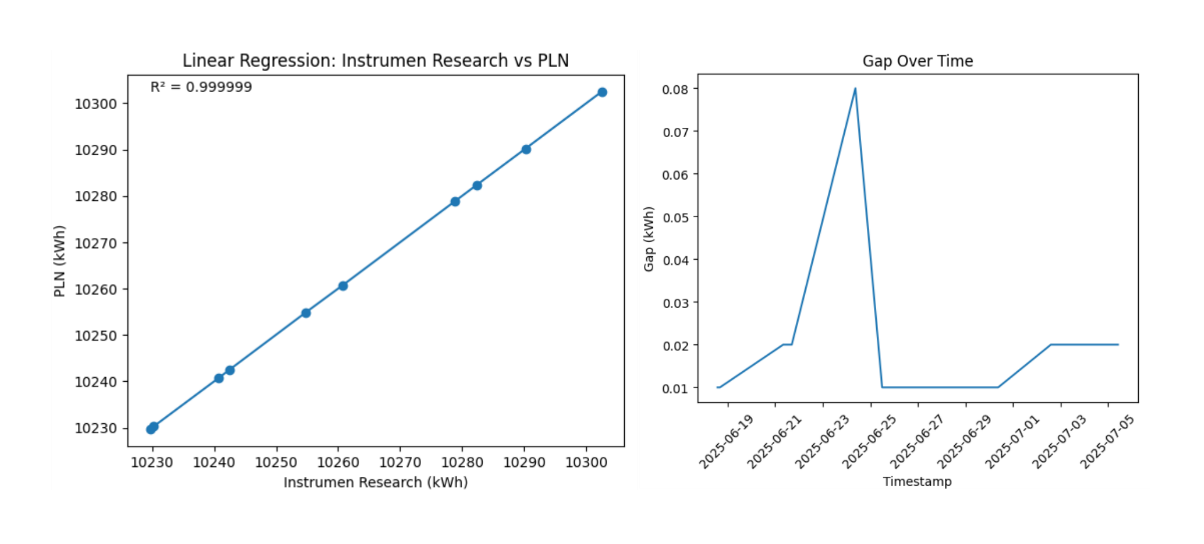
The evaluation method was manual and honest: photograph the instrument and the official PLN meter at the same moment, then compare the numbers. The published table holds ten paired readings taken between June 18 and July 5, 2025, with cumulative energy climbing from 10,229.72 kWh to 10,302.49 kWh over that window.
The agreement is close to exact. The mean gap is 0.021 kWh with a standard deviation of 0.02132 kWh, the largest single gap is 0.08 kWh, and linear regression gives a slope of 1.000349, an intercept of -3.589572, and a coefficient of determination of 0.9999988. Error metrics follow the same pattern, with an MAE of 0.01934 kWh, an RMSE of 0.02696 kWh, and a MAPE of 0.0001885 percent, all consistent with the PZEM-004T's rated energy tolerance of 0.5 percent.
What the Paper Does and Does Not Publish
The paper is a complete system description, but it is not a maker repository. No firmware sources, schematics beyond the block diagram, bill of materials, or cost figures are published, and the paper never names the Ethernet library that drives the W5500, so the socket-level implementation cannot be inspected. The photographs exist only as low-resolution images embedded in the PDF, which is why the images in this post are modest in quality.
The parts list is also deliberately unexotic. ESP32 plus PZEM-004T plus W5500 is an established recipe in the maker world, and this site has carried it before. What makes this instance worth reading is everything around the parts: a government field station as the site, a routed office LAN as the transport, a published accuracy validation against the utility meter, and a paper trail with dates.
Related WIZnet Maker Projects
ESP32 - Solar Power Monitoring 2 PZEM-017 PZEM-004T Via Websocket Server | Ethernet W5500 | Arduino uses the same ESP32, PZEM-004T, and W5500 trio, published here in March 2026. The difference is the setting: that build monitors a solar setup over a WebSocket UI, while the BMKG system is a 3-phase institutional deployment validated against a utility meter. Together they show one parts recipe serving both a bench project and a government installation.
Simple 3 Phase Arduino Energy Meter With Ethernet Connection tackles the same 3-phase measurement problem with an Arduino and an Ethernet shield. It is a DIY meter built around current sensing alone, where the BMKG paper adds per-phase PZEM modules, a database schema, and a formal accuracy evaluation, so the two posts read as the hobby and institutional ends of the same idea.
IoT Based Smart Energy Meter Using Modbus Protocol as Electricity Saving Effort is another academic smart-meter paper curated on this site. It centers on the Modbus protocol for meter communication, while the BMKG system sends readings straight over a plain LAN into MySQL, which makes the pair a useful comparison of protocol choices for the same energy-saving goal.
FAQ
Q. Which WIZnet chip does the BMKG Sleman electricity monitor use, and how is it connected? The system uses a W5500 Ethernet module on the ESP32's SPI bus. The paper states the module is "physically connected using a UTP cable to a network switch installed in the Graha Building," from where a router delivers the data to a PC at 192.168.1.95.
Q. Why does the system use Ethernet instead of the ESP32's built-in Wi-Fi? The paper does not make a wired-versus-wireless argument. It states that a local network topology was implemented "to ensure stable data transmission," and the installed design uses only the cabled W5500 path through the station's existing switches and router.
Q. How accurate is the monitor compared with the official PLN meter? Across ten paired readings in June and July 2025, the mean difference was 0.021 kWh with an R squared of 0.9999988 and a MAPE of 0.0001885 percent. That sits comfortably inside the PZEM-004T's rated 0.5 percent energy tolerance.
Q. Is the firmware or source code available? No. The paper describes the architecture, the 3-phase calculation logic, the database schema, and the dashboard, but publishes no repository, so the Ethernet library and socket code behind the W5500 remain unknown.
Q. Can this design be replicated for another building? The hardware side is straightforward, since every part is a commodity module and the paper documents the wiring buses, the network topology, and the database tables. A replicator would need to write their own firmware and web code, and a single PZEM-004T per phase limits the approach to one metering point per instrument.
-
Article page (JoCPES, open access)
Abstract, author list, and publication dates. Published online March 19, 2026.

-
Full paper PDF
Complete paper with hardware design, network topology, deployment photos, and evaluation data. CC BY-SA.
-
DOI record
Persistent identifier for the paper, JoCPES Vol. 5 No. 2, pages 137-144
-
Journal of Computation Physics and Earth Science (JoCPES)
The open-access journal that published the paper, ISSN 2776-2521
-
STMKG
The Indonesian state college of meteorology, climatology, and geophysics where eight of the nine authors study
-
BMKG
Indonesia's Agency for Meteorology, Climatology, and Geophysics, which operates Geophysics Station Class I Sleman
-
WIZnet W5500
Hardwired TCP/IP Ethernet controller used as the instrument's network interface


