
FFF Project: Flame-Free Farm
The FFF Project is an innovative IoT solution designed to enhance farm safety and prevent fires by alerting farmers to potential risks
WIZnet - W7500
x 1
WIZnet - Surf5
x 1
microsoft - Visual Studio 2017
x 1

Arduino - Arduino IDE
x 1
FFF PROJECT: Flame-Free Farm
Problem

Livestock farming is a crucial sector in the economy, providing food sources such as meat and milk, along with other by-products for human consumption. However, livestock farms also face a high risk of fire, which can be triggered by various factors. Common causes of farm fires include electrical short circuits and discarded cigarette butts by workers. This risk is further exacerbated by the presence of methane gas (CH4). The manure from livestock, especially cattle and goats, contains high levels of organic matter that, when decomposed by microorganisms through anaerobic fermentation, produces methane as a primary by-product. Methane is a highly flammable gas that can form explosive mixtures in the air if it accumulates in sufficient concentrations. This situation makes livestock farms a hazardous environment prone to fires, posing threats not only to the safety of the animals and workers but also potentially causing significant economic losses and environmental damage. Therefore, an effective early fire detection system is necessary to proactively monitor and manage this risk.
Solutions
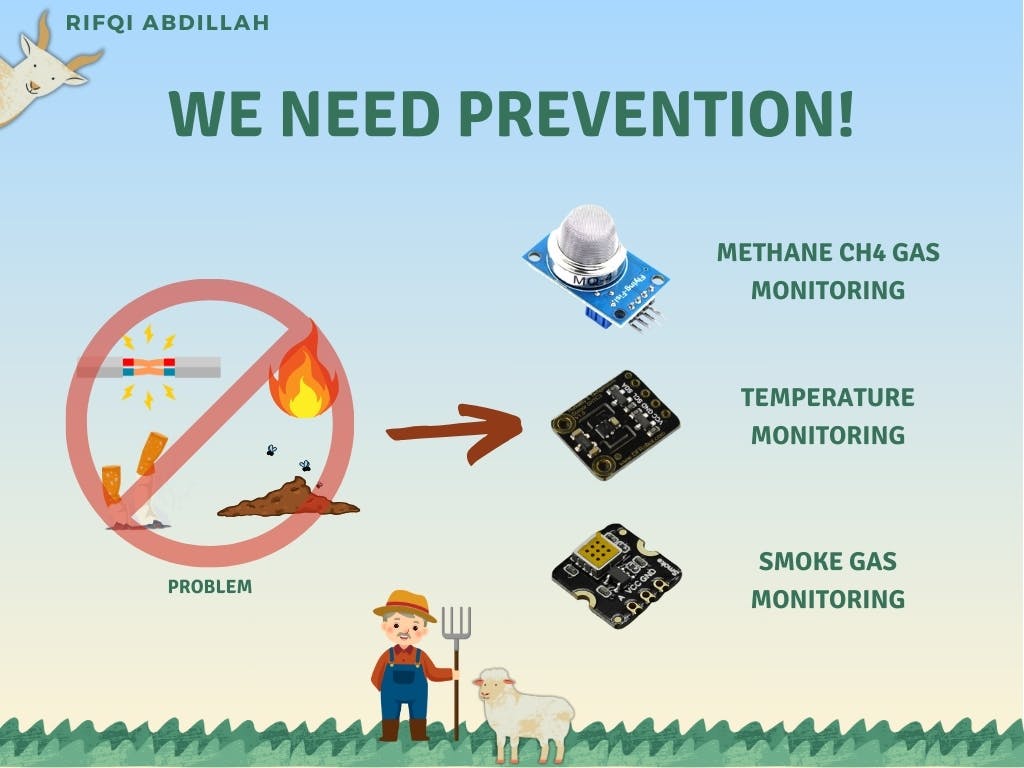
We need to implement serious preventive measures to address this issue. To tackle this problem, the FFF Project has been developed. The FFF Project is a system designed to monitor methane gas levels, significant temperature changes above threshold limits, and the presence of smoke that may arise from electrical short circuits or discarded cigarette butts. This comprehensive monitoring system aims to provide early detection of potential fire hazards, ensuring timely interventions and enhancing the safety and security of livestock farms. By continuously tracking these critical parameters, the FFF Project helps prevent fires, thereby protecting livestock, workers, and the farm's infrastructure from potentially devastating incidents.

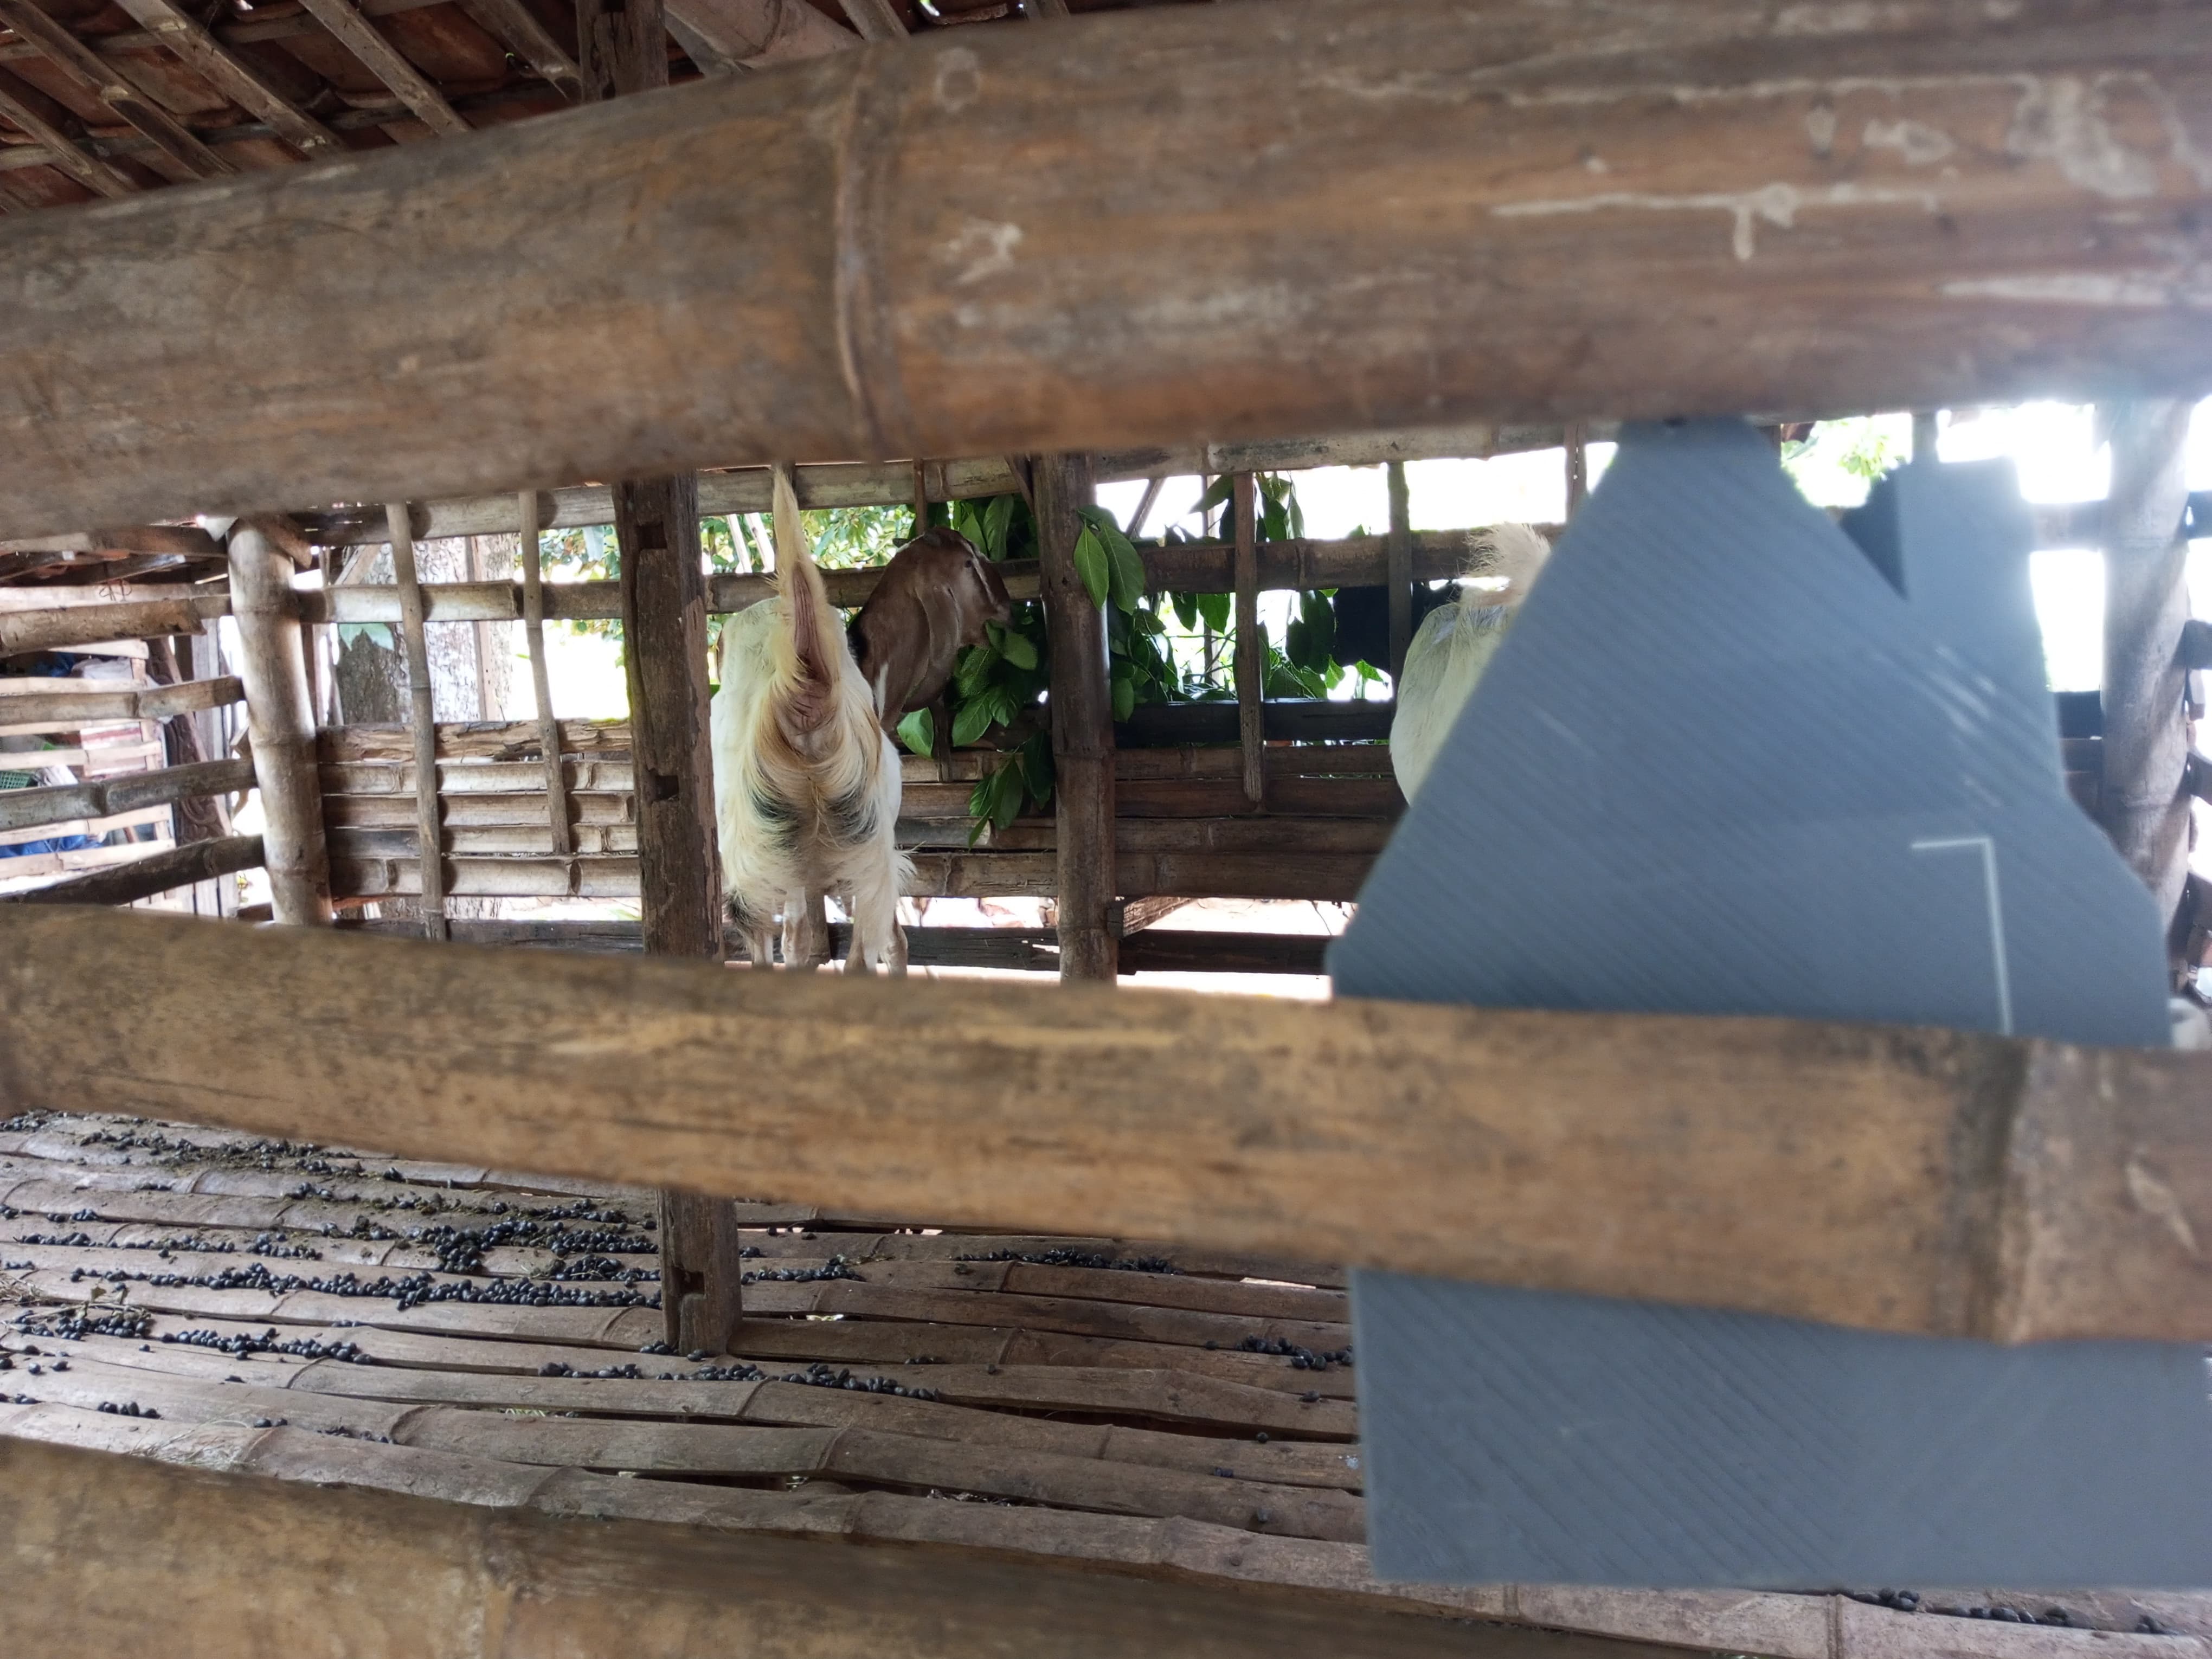
Additionally, to enhance the security of the livestock, a goat counter feature has been incorporated. Many farmers, including my father, have expressed concerns about goat theft. Therefore, this feature has been added to the FFF Project as a supplementary tool to count the number of goats in the pen. This helps in ensuring the goats' safety and provides peace of mind to the farmers by enabling them to monitor and verify the presence of all their livestock at all times.
How it works?
_K5LGgeJPq5.jpg?auto=compress%2Cformat&w=740&h=555&fit=max)
The second subsystem involves building a web server for remote monitoring without the need to be physically present. This subsystem is built using the SURF 5 board for the monitoring process. The SURF 5 board will be connected via WLAN cable and linked to the internet. SURF 5 will then function as a web server where users can monitor the results of the monitoring carried out by the first subsystem. Communication between the two subsystems is conducted using serial communication, ensuring that data from the monitoring process can be transmitted to the web server for remote monitoring.
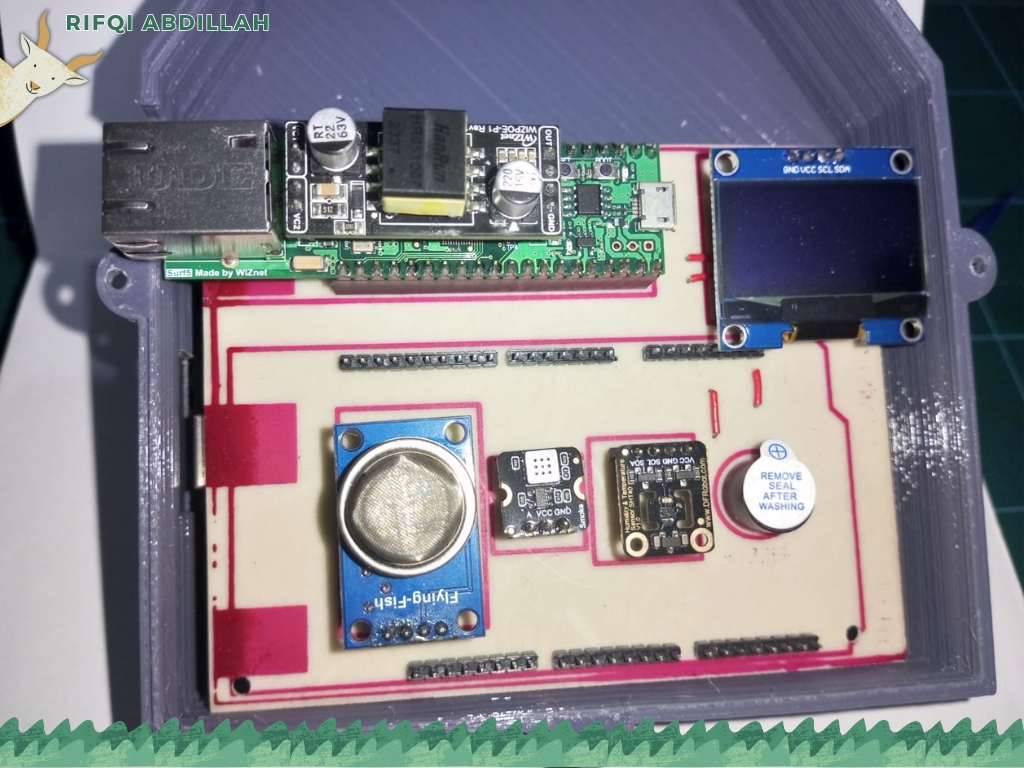
Hardware components
- WIZnet SURF 5 Board
- WIZnet WIZPoE-P1
- DFRobot Fermion: MEMS Smoke Gas Detection Sensor
- DFRobot Fermion: SHT40 Temperature & Humidity Sensor
- MQ4 Sensor
- Grove Vision AI Module V2
- Arduino Mega 2560
- 0.96" OLED 64x128 Display Module
- Routers
- Lan cable
- USB type A cable
- Buzzer
Software apps and online services
- Microsoft VS Code
- WIZnet W7500 ISP Tool
- Hercules SETUP utility
- Arduino IDE
- Autodesk EAGLE
- Solidworks
- Ultimaker Cura
Hand tools and fabrication machines
- Soldering iron
- Solder tin
- 3D Printer
- Cutter
- Screws and Hexnut
Step by Step
- Testing OLED 0.96 Inch Screens
- Sensor Testing and OLED Display Integration
- Integrating Arduino with SURF 5 Boards for Data Transmission
- Designing an Accurate Goat Counting System
- Building Effective Web Monitoring Solutions
- Designing and Fabricating Custom Printed Circuit Boards
- Designing Functional 3D-Printed Casings
- System Testing
1. Testing OLED 0.96 Inch Screens
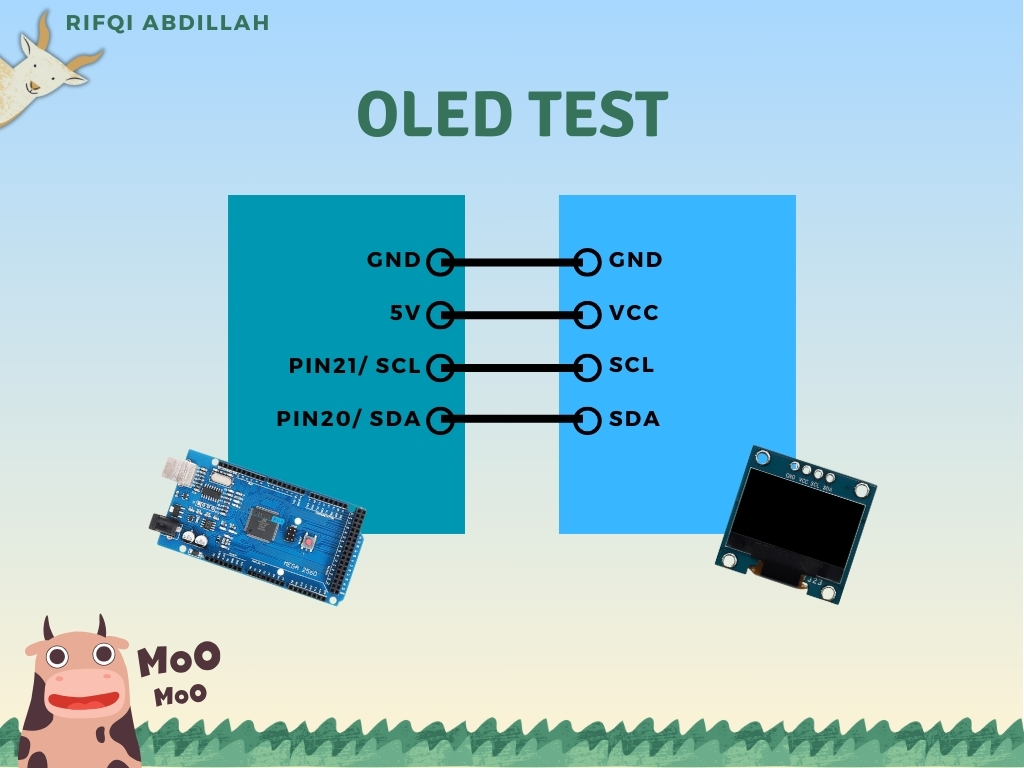
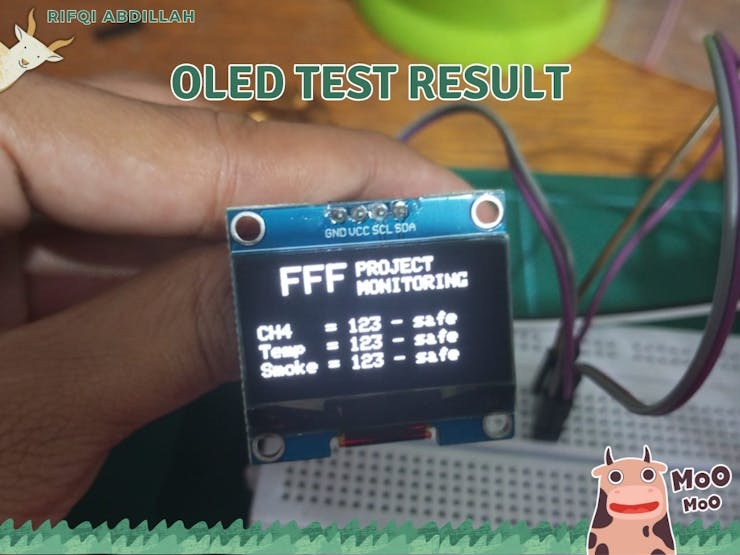
The first step we took involved testing the OLED using an Arduino. In this project, we used an Arduino Mega, which is compatible with the OLED that utilizes the I2C communication system. The chosen OLED is 0.96 inches in size, which is suitable for displaying information clearly and concisely. This OLED will be used to display monitoring results, such as sensor data or system status. Before starting the programming, we need to ensure all components are connected correctly and functioning properly. Make sure to connect the pins according to those in the picture.
We can program the OLED using the Arduino IDE. The first step is to download the Adafruit SH110X.h library, which provides various functions for operating the OLED. Once the library is installed, you can start creating code by looking at the example code available in the Arduino IDE and modifying it according to the project's needs. This process involves adjusting the code to read data from sensors and display that information on the OLED screen. With this approach, we can develop an effective and user-friendly monitoring system. You can download the code at this link or access it in the attachment
Attachment
Attachment 1.1 : Oled 0.96 Inch Code
2. Sensor Testing and OLED Display Integration
_uBcjld1yTY.jpg?auto=compress%2Cformat&w=740&h=555&fit=max)
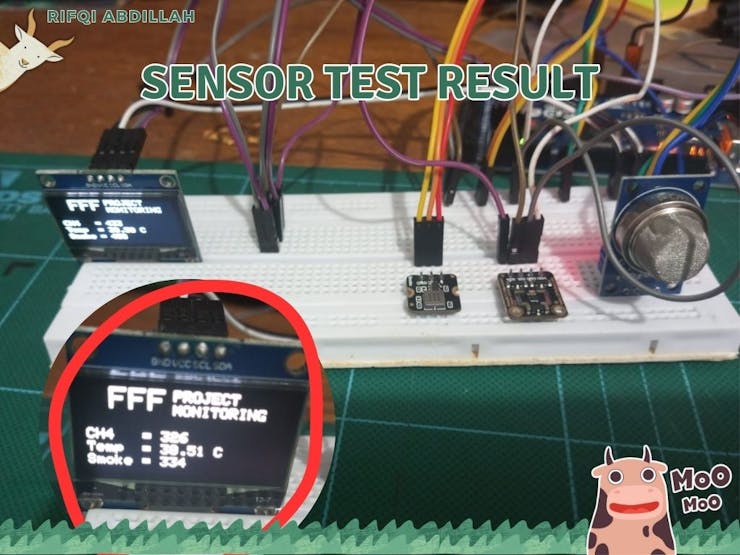
Next, we will connect the sensors that will be used to monitor the farm. There are three sensors that we will use: first, the MQ4 sensor to monitor CH4 gas produced from livestock waste; second, the MEMS Smoke sensor for early detection of potential fires caused by electrical short circuits or cigarette butts; and lastly, the SHT40 sensor to monitor the temperature inside the barn.
Reading the MQ4 sensor and the MEMS Smoke sensor is very easy with Arduino because they use standard analog reading. The selected pins are A0 for the MQ4 sensor and A1 for the MEMS Smoke sensor.
For the SHT40 sensor, the I2C communication system will be used, which shares the same pins as the OLED, namely pin 21 and pin 20. The difference lies in the addresses used, where the SHT40 has an address of 0x44 while the OLED has an address of 0x3C. You can access all the code used for this experiment through this link or in the project attachment. The results of the experiment can be seen in the image below.
Attachment
Attachment 2.1 : MQ4 Sensor Code
Attachment 2.2 : MEMS Smoke Sensor Code
Attachment 2.3 : SHT40 Code
3. Integrating Arduino with SURF5 Boards for Data Transmission
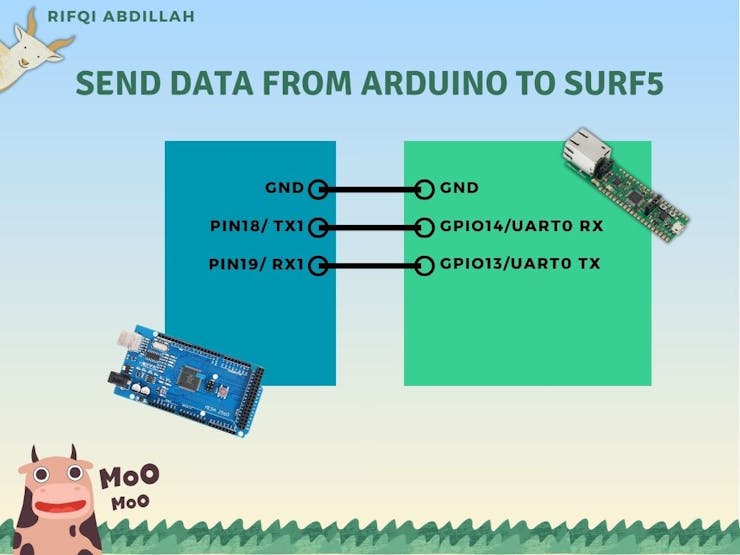
Data has been acquired using an Arduino Mega, and the data will then be sent to the SURF5 board for further transmission to the user. This data transmission process will use a serial communication system, which is supported by both boards being used. Serial communication in microcontrollers has several important advantages, such as simplicity of implementation, low cost and complexity, and the ability to transmit data over long distances.
The data transmission process from the Arduino will use UART1 on the Arduino Mega via pins 18 and 19, while on the SURF5, UART0 will be used on pins 13 and 14. It is important to match the baud rate between the two boards to ensure the data can be read properly. The baud rate used is 115200. The baud rate in serial communication must be the same between the transmitting and receiving devices to synchronize the data correctly. Differences in baud rate can cause errors in bit interpretation, frame errors, and reduce communication reliability, so ensuring the same baud rate is crucial for data integrity and efficiency.
Programming it is very easy, as we only need to use the command Serial1.println("Text") on the Arduino Mega to transmit data via the serial pins to the SURF5 board. Below is the code used. In this code, the Arduino Mega will continuously send the text "Rifqi" via serial communication to the SURF5 board.
void setup() {
    Serial1.begin(115200);
    Serial.begin(9600);
    while (!Serial) {
        ;
    }
    Serial.println("Serial communication started on Serial1 (TX1/RX1)");
}

void loop() {
    Serial1.println("Rifqi");
    delay(1000);
}
Next, we will begin the reading process from the SURF5 board. If you are new and have never tried using the SURF5 board, you can follow the step-by-step guide on the official website to create your first project. On this board, we can use the example provided in the UART section to program it using the code below. In this code, it is stated that when data is received, it will be printed using the code printf("Received : %c\r\n", UART_ReceiveData(UART0));
while (1) {
if (UART_GetFlagStatus(UART0, UART_FLAG_CTS) == SET) {
// UART_SendData(UART0, 0x31);
// while (UART_GetFlagStatus(UART0, UART_FLAG_BUSY) == SET)
// ;
}
if (UART_GetFlagStatus(UART0, UART_FLAG_RXFE) == RESET) {
printf("Received : %c\r\n", UART_ReceiveData(UART0));
}
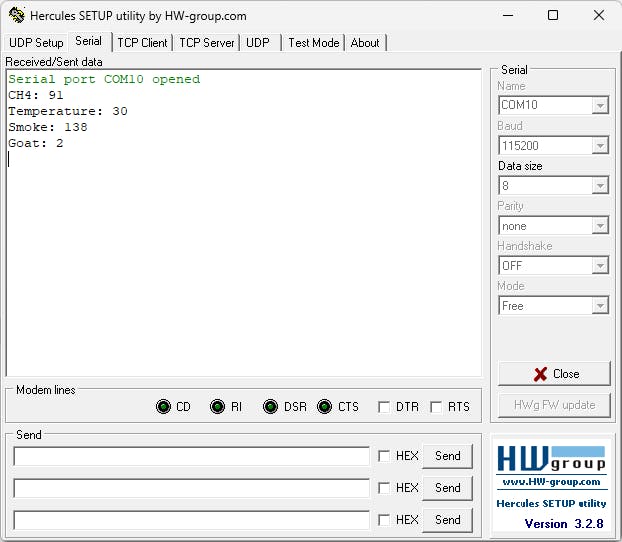
}Next, we will check the reading results using the Hercules application. The Hercules Serial application is a software tool used to test and diagnose serial communication on a computer. This program allows users to send and receive data through serial (COM) ports, monitor data traffic, and debug serial devices such as microcontrollers, sensors, and communication modules. After selecting the port to be used, you can click the "Open" button, and the results will be displayed as shown in the image below.
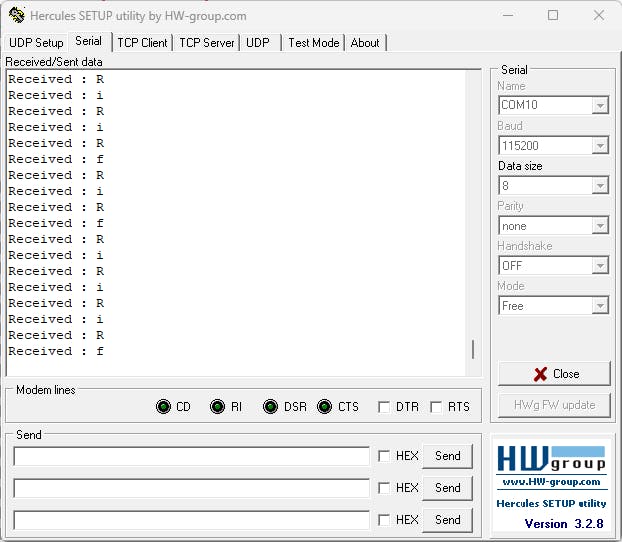
As we know, the data we are transmitting is the word "Rifqi" every 1 second. However, based on the results shown in the image, the data is not received properly by the SURF5 board. The data received is still incomplete and fragmented, character by character. The image shows that only the letter "R" appears very frequently, followed by the letters "I" and "F".
Data can still be lost and not transmitted perfectly even if the baud rate is the same. This can be caused by several other factors. One of them is the buffer issue or response time on the receiving device. If the buffer on the SURF5 board is too small or not fast enough to process the received data, then the data can be lost or not received correctly. Therefore, I made some modifications to the code on both the Arduino and the board.
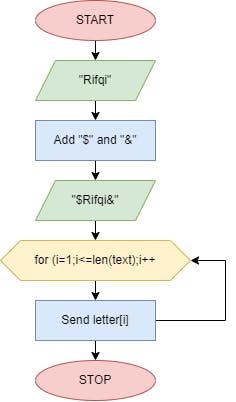
On the Arduino, we will send the data character by character as shown in the block diagram above. However, before sending the data, we need to ensure there are clear markers indicating where the receiver should start and stop storing the data. In this case, we will use the character "$" to indicate the start of the data to be sent and the character "&" to mark the end of the data transmission. Therefore, we need to modify the main loop as follows. We will attempt to send the word "Rifqi" to the SURF5 Board using the following code.
void loop() {
    const char* message = "$Rifqi%";
    for (int i = 0; message[i] != '\0'; i++) {
        Serial.println(message[i]);
        Serial1.println(message[i]);
        delay(50);
    }
delay(1000);
}
Meanwhile, on the SURF5 Board, we will make modifications as shown in the block diagram below. In the program loop, we will place the code to read serial data as usual. When the character "$" is detected, a flag will be activated to start the data storing process. Data will begin to be stored until the character "&" is detected, which will act as a flag to end the data storing process. The data will be stored in a buffer variable, which we can then use in its entirety.
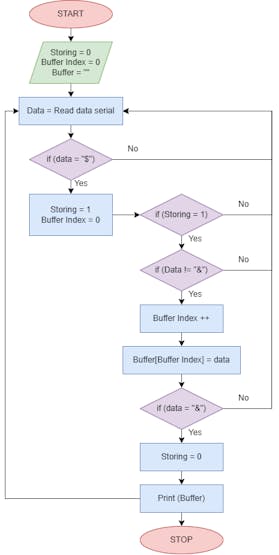
The modification is done by adding three if functions inside while(1) . The first if function aims to store incoming data by first checking that the incoming data is not the character "&" and that the storing flag is set to 1. The second if function acts as a marker to start the storing process by first checking if the received character is "$". The final if function is to end the data transmission process by first checking if the received character is "&".
while (1) {
if (UART_GetFlagStatus(UART0, UART_FLAG_RXFE) == RESET) {
char received_char = UART_ReceiveData(UART0);
// printf("Received : %c\r\n", received_char);
if (storing == 1 && received_char != '&' && buffer_index < BUFFER_SIZE - 1) {
if (received_char != '\n') { // Skip newline characters
buffer[buffer_index++] = received_char;
}
}
if (received_char == '$') {
storing = 1;
buffer_index = 0; // Reset buffer index
}
if (received_char == '&') {
storing = 0;
buffer[buffer_index] = '\0'; // Null-terminate the buffer
printf("Received : %s\r\n", buffer);
}
}
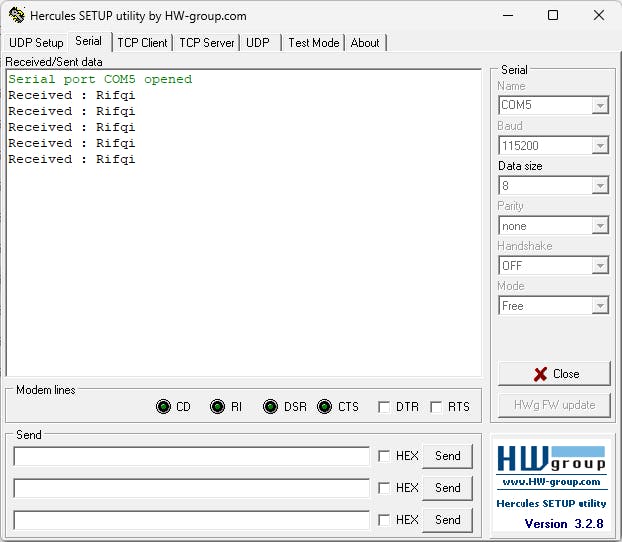
}You can see the results that after applying this method, we can receive the data "Rifqi" sent from the Arduino completely as it was sent. This can be seen in the Hercules application after we click the "Open" button, as shown in the image below.
char data_send[50];
sprintf(data_send, "$%d,%d,%d,%d&", CH4Value, temperature, smoke_data, goat);if (received_char == '&') {
storing = 0;
buffer[buffer_index] = '\0'; // Null-terminate the buffer
strcpy(data_arduino, buffer); // Copy buffer content to data_arduino
// Parse data_arduino based on commas
char *token;
int count = 0;
token = strtok(data_arduino, ",");
while (token != NULL && count < 3) {
switch (count) {
case 0:
printf("CH4: %s\r\n", token);
// Assuming you want to store CH4 data
strcpy(CH4, token);
break;
case 1:
printf("Temperature: %s\r\n", token);
// Assuming you want to store Temperature data
strcpy(Temperature, token);
break;
case 2:
printf("Smoke: %s\r\n", token);
// Assuming you want to store Smoke data
strcpy(Smoke, token);
break;
case 3:
printf("Goat: %s\r\n", token);
// Assuming you want to store Goat data
strcpy(Goat, token);
break;
default:
break;
}
token = strtok(NULL, ",");
count++;
}
}Thus, we will get a result as shown in the image below, where the data is already well partitioned and stored according to their respective variables. As a note, for the goat data, we are still sending the number 2 at this stage because in the next section we will delve deeper into the overall machine learning model for counting goats.
Attachment
Attachment 3.1 : Arduino Code Send Data to SURF 5
Attachment 3.2 : SURF5 Code to read data from Arduino
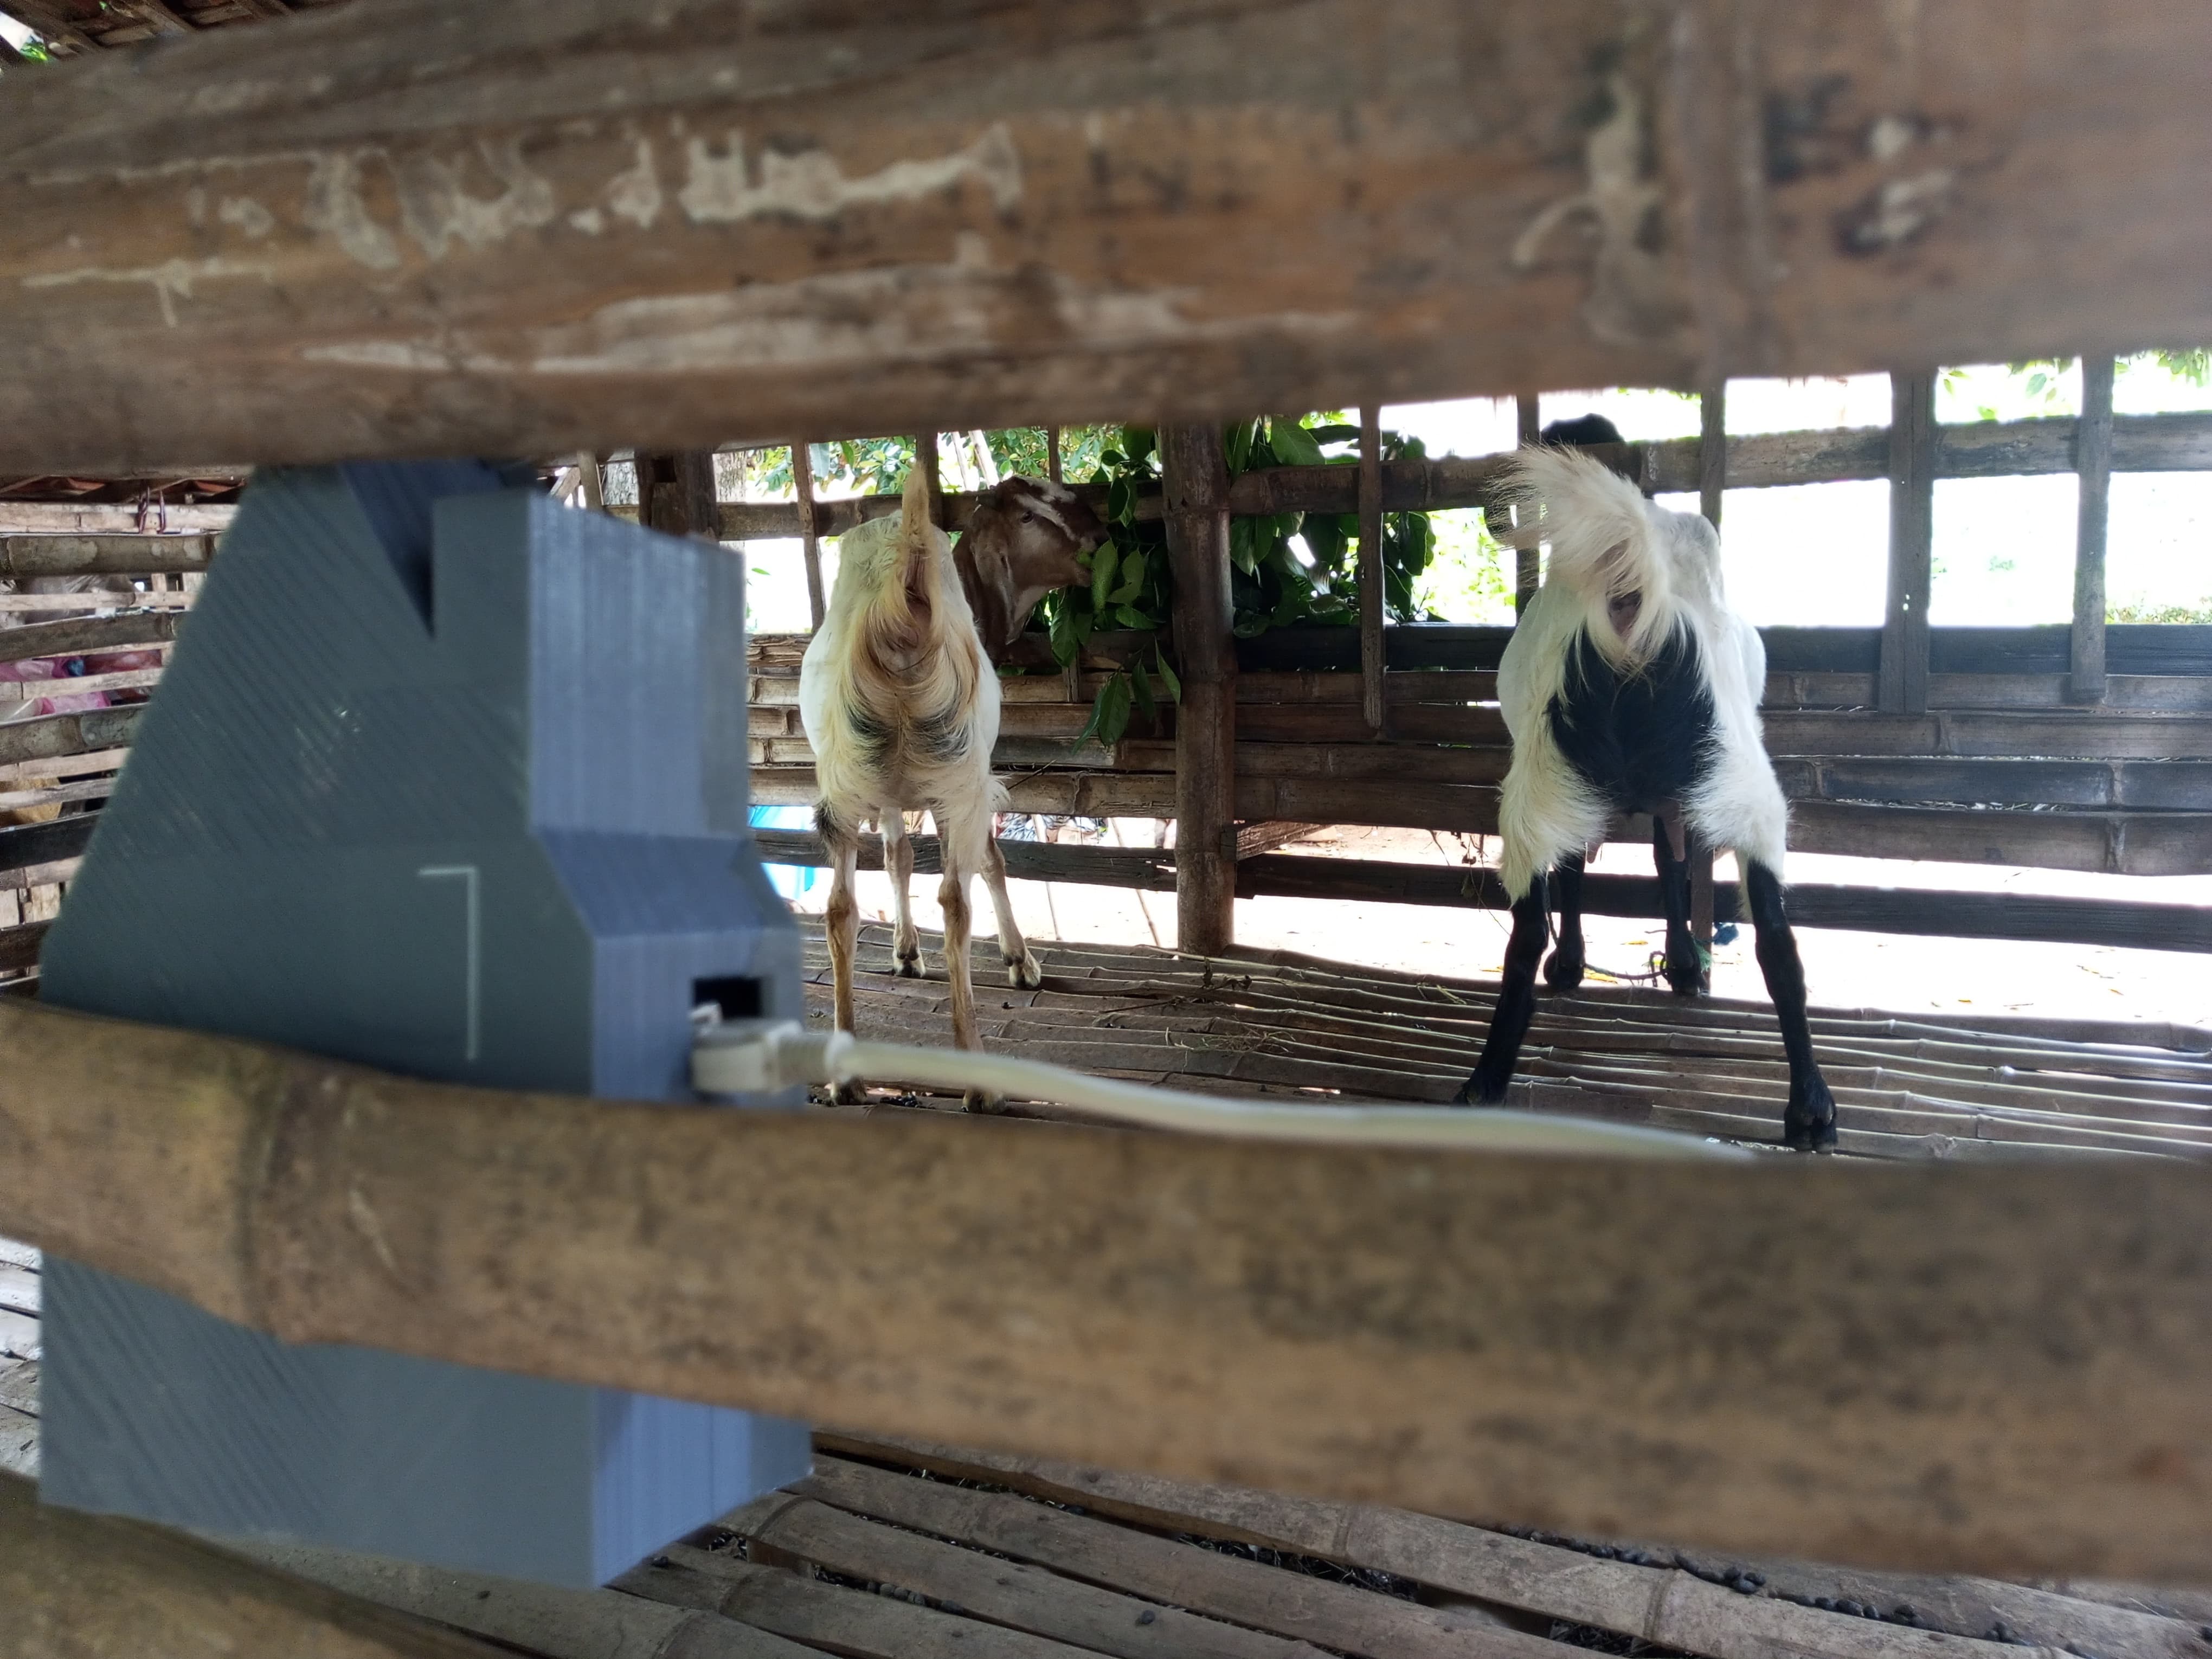
4. Designing an Accurate Goat Counting System
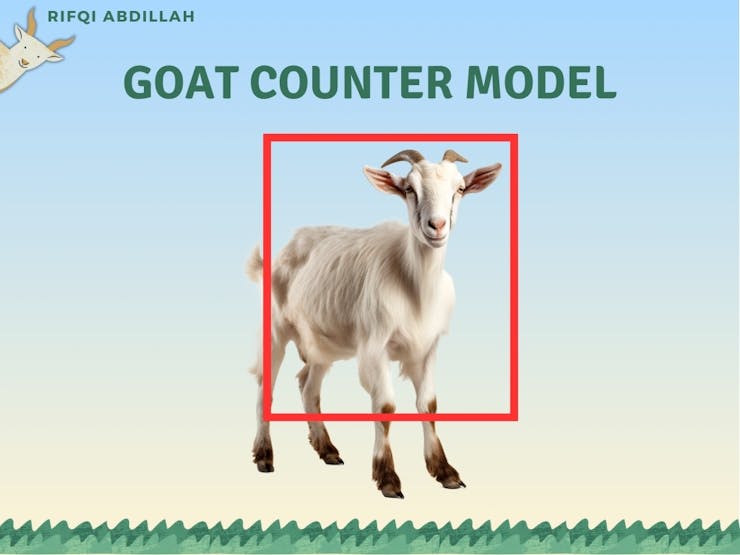
In this section, we will create a model to count the number of goats in a pen using AI. We will use the Grove Vision AI module for this purpose. The Grove Vision AI Module represents a thumb-sized AI camera with a customized sensor that already has a machine learning algorithm installed for people detection and other customized models. Easily deployed and displayed within minutes, it operates under an ultra-low power model and provides two ways of signal transmission and multiple onboard modules, making it perfect for getting started with AI-powered cameras.
At this stage, we will use three supporting software tools to create the goat counting model: Roboflow, YOLOv5, and TensorFlow Lite. Roboflow is an online annotation tool that allows you to easily annotate all your images, add further processing to those images, and export the labeled dataset into various formats such as YOLOV5 PyTorch, Pascal VOC, and others! Roboflow also has public datasets available for users. YOLO stands for 'You Only Look Once.' It is an algorithm that detects and recognizes various objects in images in real-time. Ultralytics YOLOv5 is a version of YOLO based on the PyTorch framework. TensorFlow Lite is an open-source, ready-to-use, cross-platform deep learning framework that converts pre-trained models in TensorFlow into a special format that can be optimized for speed or storage. Models in this special format can be deployed on edge devices such as smartphones using Android or iOS, or embedded devices based on Linux such as Raspberry Pi or microcontrollers for performing inference at the edge.
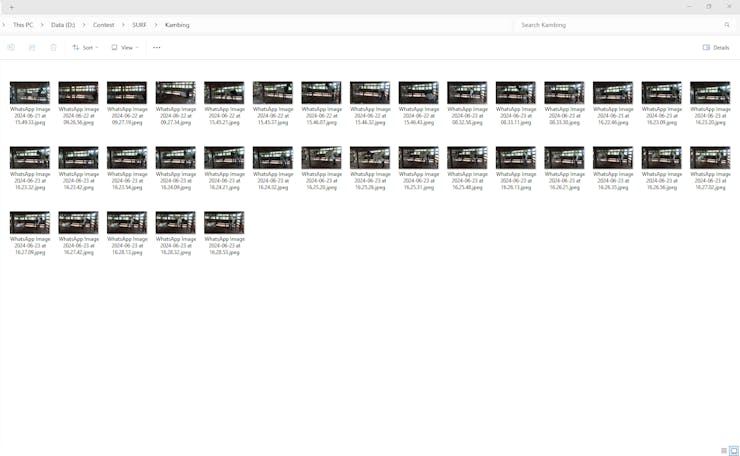
As with the usual machine learning model creation process, the first step is to prepare the dataset. For this project, the dataset will consist of a collection of images of goats in a pen, taken using a camera. We have collected 35 images to be used as the dataset. This dataset will serve as the foundation for training the machine learning model to detect and recognize goats in images with high accuracy. Ensure these images have enough variation to help the model learn from different angles and lighting conditions.
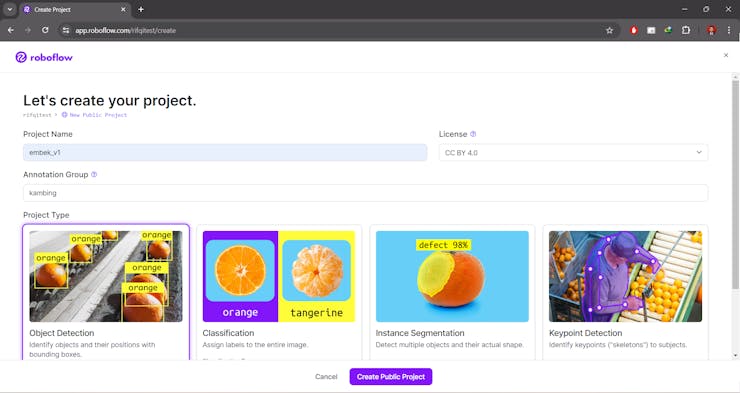
Next, we will go to the Roboflow website. The first step is to create a new project. In this project, we will use object detection. Object detection is used to detect objects and their positions using bounding boxes. Once the new project is created, the next step is to upload the previously collected images to the Roboflow website. By uploading this image data, we ensure that all necessary data is ready for further processing. Make sure all images have been collected and prepared properly before uploading to ensure the quality and accuracy of the model to be developed.
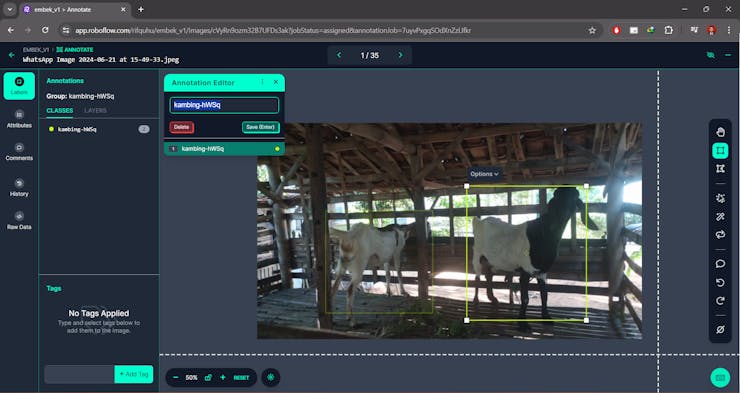
Next, we just need to follow the entire process. We will then reach the image annotation stage. In this part, we will manually annotate the images. Annotation is done to label specific points that represent the images we will select in our dataset. For example, since we are creating a model for goat detection, we will mark an image indicating where the goat is located
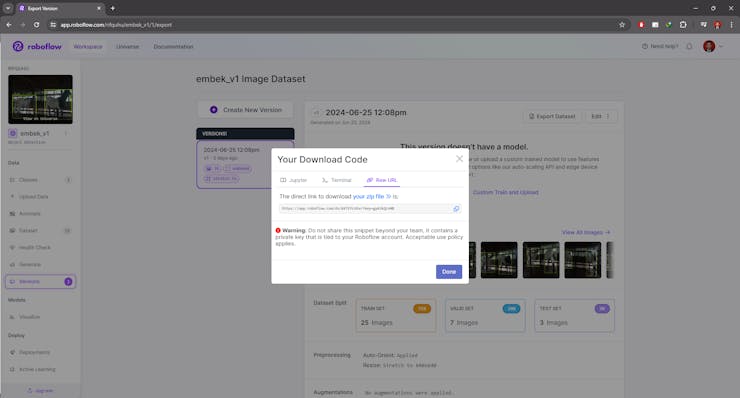
After annotating all the images, our dataset will be ready for use. On Roboflow, you have the option to download the dataset or use it directly on the website. For this project, we will use Google Colab, so we will utilize the link to the dataset we have created. By using this link, we can access the dataset directly in Google Colab without needing to download it first, which simplifies the integration and training process of our machine learning model. Make sure to note down the dataset link so it can be easily used in your Colab notebook
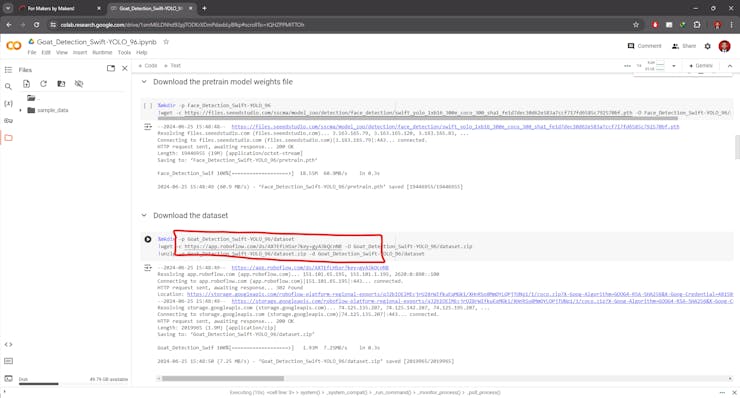
You can find a variety of ready-to-use programs as references at this link. Next, I will try to modify the face detection code. You don't need to change the code that will be used because the provided code can be used directly without any modifications. All you need to do is paste the dataset you created earlier using Roboflow. After pasting the code you have created, you can run the code as it is.
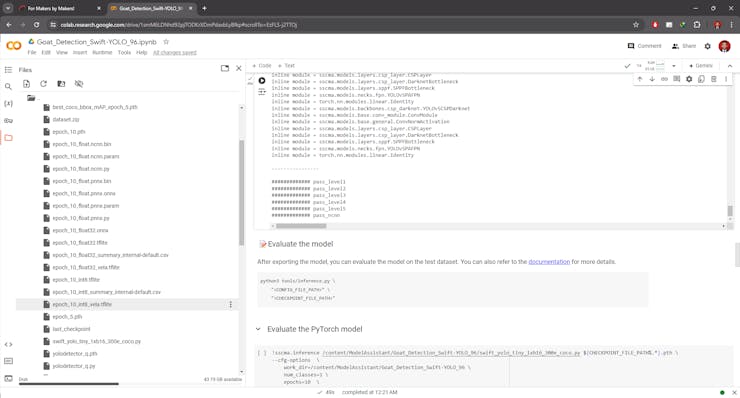
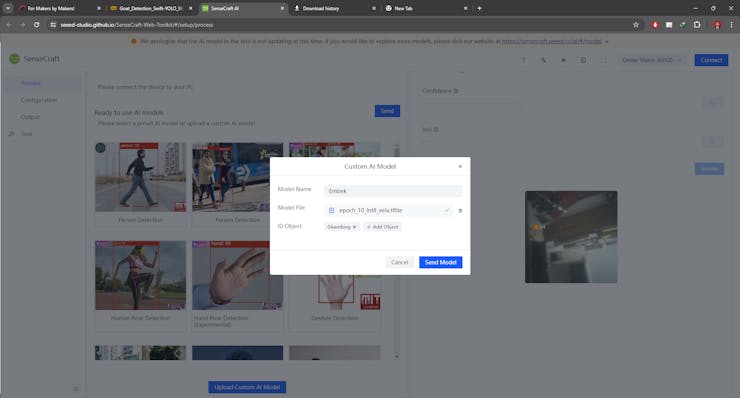
After all the code is executed, you will get a model file named "epoch_10_int8_vela.tflite". The next step is to download this file to your computer for further use. You can do this by clicking the download link that appears or using a file transfer tool as needed. This file contains the trained and optimized model, ready to be used for inference or implementation on the targeted device. Make sure to save the file in a secure and easily accessible location to facilitate the integration and testing process
Next, connect the Grove Vision AI V2 to your laptop or computer using a Type-C cable. Once connected, click the "Connect" button to start the pairing process between your device and the SenseCraft website. After pairing is successful, you can begin uploading the model you previously downloaded. On the upload page, fill in the model name, file location, and the object ID to be used. Once all the information is correctly filled out, you can send this data directly to the Grove Vision AI V2. This process will enable the device to use the uploaded model to perform inference tasks as needed. Ensure all steps are carried out carefully to ensure smooth setup and optimal model performance on your device.
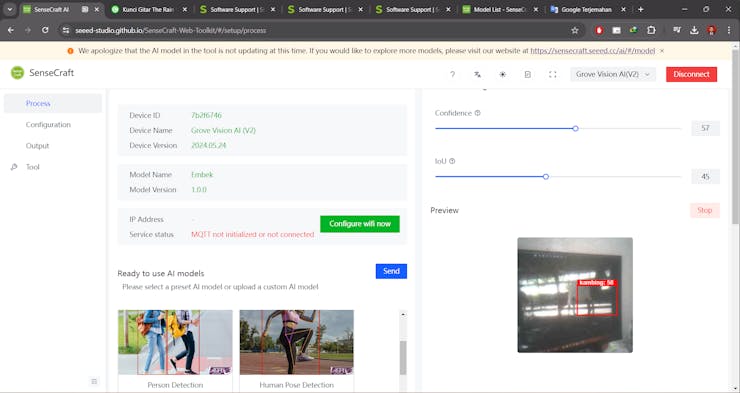
Here are the results displayed when you have successfully uploaded the created model to the device. It appears that the model has been quite successful in detecting goats. However, some errors still occur. Therefore, in the future, if you want to create a similar project, you need to pay more attention to this aspect to produce a model with higher accuracy. Continuous evaluation and improvement are crucial for enhancing model performance, including increasing the amount of training data, improving annotations, and trying data augmentation techniques.
Attachment
Attachment 4.1 : Goat Dataset
Attachment 4.2 : Machine Learning Model
Attachment 4.3 : Creating Model Code
5. Building Effective Web Monitoring Solutions
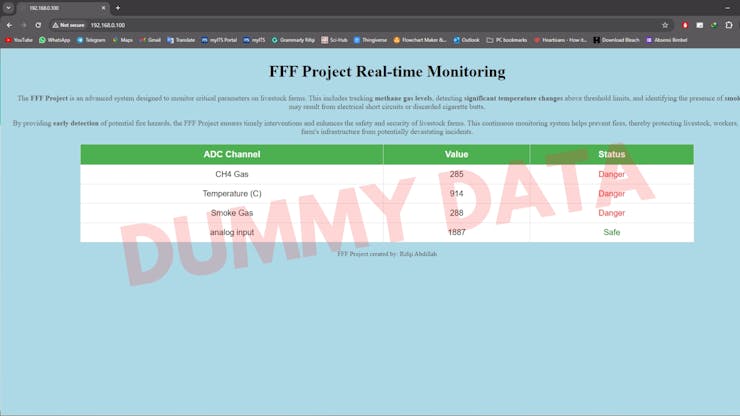
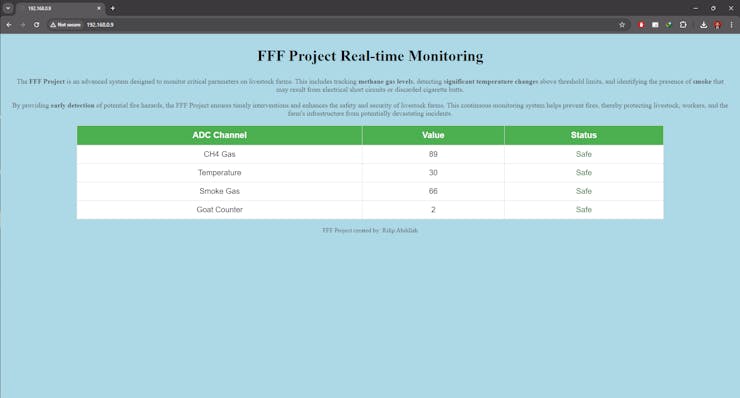
I have modified the web server program on the W7500 to display the ADC signal in a more interactive and informative website format. Initially, the program only displayed simple text, but now I have added several important elements. I added the title "FFF Project Real-time Monitoring" at the top of the page to give a clear identity, as well as a brief description of the project's purpose and benefits, which is to monitor critical parameters on the farm such as methane gas levels, significant temperature changes, and the presence of smoke that could come from electrical short circuits or cigarette butts.
const char *responseBodyStart = "<!DOCTYPE HTML>\r\n"
    "<html>\r\n"
    "<head>\r\n"
    "<style>\r\n"
    "body { background-color: #add8e6; }\r\n"
    "table { font-family: Arial, sans-serif; border-collapse: collapse; width: 80%; margin: auto; background-color: white; }\r\n"
    "td, th { border: 1px solid #dddddd; text-align: center; padding: 12px; font-size: 20px; }\r\n"
    "th { background-color: #4CAF50; color: white; font-size: 22px; }\r\n"
    ".center { text-align: center; }\r\n"
    ".description { font-size: 18px; color: #555; text-align: center; margin: 20px; }\r\n"
    ".title { font-size: 40px; color: black; }\r\n"
    ".footer { text-align: center; font-size: 16px; color: #555; margin-top: 20px; }\r\n"
    "</style>\r\n"
    "</head>\r\n"
    "<body>\r\n"
    "<div class=\"center\">\r\n"
    "<h2 class=\"title\">FFF Project Real-time Monitoring</h2>\r\n"
    "<p class=\"description\">The <strong>FFF Project</strong> is an advanced system designed to monitor critical parameters on livestock farms. This includes tracking <strong>methane gas levels</strong>, detecting <strong>significant temperature changes</strong> above threshold limits, and identifying the presence of <strong>smoke</strong> that may result from electrical short circuits or discarded cigarette butts.</p>\r\n"
    "<p class=\"description\">By providing <strong>early detection</strong> of potential fire hazards, the FFF Project ensures timely interventions and enhances the safety and security of livestock farms. This continuous monitoring system helps prevent fires, thereby protecting livestock, workers, and the farm's infrastructure from potentially devastating incidents.</p>\r\n"
    "</div>\r\n"
    "<table>\r\n"
    "<tr><th>ADC Channel</th><th>Value</th><th>Status</th></tr>\r\n";
const char *responseBodyEnd = "</table>\r\n"
    "<div class=\"footer\">FFF Project created by: Rifqi Abdillah</div>\r\n"
    "</body>\r\n"
    "</html>\r\n";
The page design has been updated with a light blue background for a more appealing and calming appearance. The data table is designed to be centered on the page with an 80% width and a white background for good contrast. The font used is Arial with a larger size to make the data easier to read. I also added several CSS classes to enhance the appearance, such as .center to center the text, .description for description text with a font size of 18px and gray color, and .title for the title with a font size of 40px and black color.
Additionally, I added a new column called "Status" in the data table. This status provides a visual indication of the ADC value condition being measured; if the ADC value is less than 1000, the status will be displayed as "Danger" with red text, whereas if the ADC value is more than 1000, the status will be displayed as "Safe" with green text.
At the bottom of the page, I added a footer with the text "FFF Project created by: Rifqi Abdillah" to provide information about the project creator. These modifications aim to provide a more informative and easy-to-read appearance, as well as to add aesthetic value to the web server page used for real-time ADC signal monitoring.
I also encountered some issues in handling the operation of sending and closing connections. The HTTP response might be incomplete, causing problems. It is crucial to ensure that the entire HTTP response is sent before closing the connection. This includes specifying the Content-Length header to inform the browser about the size of the response or using Transfer-Encoding: chunked to allow the browser to correctly determine the end of the content. Additionally, the connection might not be closed properly, causing the browser to wait indefinitely for more data. It is also important to verify that all data, including headers and HTML content, is sent correctly and completely. Properly addressing these issues will prevent the browser from continuously loading the page without any changes.
To resolve these issues, ensure the entire HTTP response is sent before closing the connection. This can be done by including the Content-Length header, which informs the browser about the exact size of the response, or by using Transfer-Encoding: chunked to allow the browser to correctly interpret the end of the content. Additionally, confirm that the connection is properly closed after all data is sent to prevent the browser from waiting indefinitely for more data.
while (1); // If socket reinitialization fails, halt the system
    ret = WebServer(1, test_buf, 80);
    if (ret < 0) {
        printf("WebServer encountered an error, restarting...\r\n");
        close(1); // Close the socket in case of error
        delay(2000); // Add a delay before attempting to restart

        // Reinitialize the socket
        if ((ret = socket(1, Sn_MR_TCP, 80, 0x00)) != 1) {
            printf("Socket reinitialization failed\r\n");
    }
}
I use a while(1) loop to ensure that the web server continues to run continuously. Inside this loop, I call the WebServer function with certain parameters and store the return value of this function in the variable ret. If the return value ret is less than 0, indicating that the web server encountered an error, I print the message "WebServer encountered an error, restarting...". Next, I close the socket by calling close(1) to ensure that the resources used by the socket are released.
Then, I add a 2000 millisecond (2-second) delay using the delay(2000) function before attempting to restart the web server. After that, I attempt to reinitialize the socket by calling the socket function and storing the result in the ret variable. If the socket reinitialization fails (the value of ret is not equal to 1), I print the message "Socket reinitialization failed" and enter the while(1); loop, causing the system to halt. This is done to prevent the system from repeatedly attempting to reinitialize the socket without success, which could lead to further issues. By adding this function, I ensure that the web server can automatically attempt to recover from errors without requiring manual intervention.
To insert the data obtained into the web server, I use a for loop according to the amount of data. In this project, there are 4 data received from the Arduino board: CH4 data, temperature data, smoke gas data, and goat count data. This code snippet is a loop that runs four times, where in each iteration, the variable i is used to determine the data to be formatted into an HTML row. In the first iteration (i == 0), the code formats the data related to CH4 gas into an HTML row using sprintf, where the row contains the CH4 value and status determined by whether the CH4 value is greater than 1000 or not. The status is displayed in green if safe and red if dangerous.
In the second iteration (i == 1), the code formats the temperature data into an HTML row with the same logic, determining the status as safe or dangerous based on the temperature value. In the third iteration (i == 2), the smoke gas data is formatted into an HTML row with the status also determined by the smoke gas value. In the fourth iteration (i == 3), the goat count data is formatted into an HTML row, although the value used is still from the Smoke variable.
After each HTML row is formatted, the send function is used to send the data through the socket specified by sn. If the data transmission fails (the ret value is less than 0), the socket is closed using the close function, and the function returns the error value (ret).
for (i = 0; i < 4; i++) {
    if (i == 0) {
        sprintf(data_buf, "<tr><td class=\"center\">%s</td><td class=\"center\">%d</td><td class=\"center\">%s</td></tr>\r\n", "CH4 Gas", CH4, (CH4 > 300) ? "<span style=\"color:green;\">Safe</span>" : "<span style=\"color:red;\">Danger</span>");
    }

    if (i == 1) {
        sprintf(data_buf, "<tr><td class=\"center\">%s</td><td class=\"center\">%d</td><td class=\"center\">%s</td></tr>\r\n", "Temperature", Temperature, (Temperature > 40) ? "<span style=\"color:green;\">Safe</span>" : "<span style=\"color:red;\">Danger</span>");
    }

    if (i == 2) {
        sprintf(data_buf, "<tr><td class=\"center\">%s</td><td class=\"center\">%d</td><td class=\"center\">%s</td></tr>\r\n", "Smoke Gas", Smoke, (Smoke > 200) ? "<span style=\"color:green;\">Safe</span>" : "<span style=\"color:red;\">Danger</span>");
    }

    if (i == 3) {
        sprintf(data_buf, "<tr><td class=\"center\">%s</td><td class=\"center\">%d</td><td class=\"center\">%s</td></tr>\r\n", "Goat Counter", Smoke, (Smoke < 1) ? "<span style=\"color:green;\">Safe</span>" : "<span style=\"color:red;\">Danger</span>");
    }

    ret = send(sn, data_buf, strlen(data_buf));
    if (ret < 0) {
        close(sn);
    return ret;
    }
In the code snippet above, we can see the thresholds for each sensor. These thresholds are set as indicators that an anomaly, such as a fire, has occurred, allowing farmers to take preventive actions. The determination is still done simply. For the CH4 methane gas sensor, I use a comparison where in free air, the sensor value ranges from 80 - 250, while when exposed to methane gas, the sensor value becomes 500. For the second sensor, the SHT40, I use a threshold of 40 °C, where the average temperature in Indonesia is 20.08 °C - 28.63 °C, and the maximum air temperature in Indonesia in 2023 and 2024 has reached 37.8–39.4°C, so I set the maximum temperature threshold at 40 °C.
For the smoke sensor, we use the same method as the first sensor, where I bring it close to a smoke source and compare it to free air conditions. It was found that in free air, the sensor value ranges from 60-160, while when brought close to a smoke source, the sensor value is above 200, so we set the threshold value at 200. Lastly, for the goat counter, we use the threshold when no goats are detected, or a goat counter value < 1, indicating goat theft as evidenced by the absence of detected goats.
I encountered another issue. The data I input into the web server for display does appear, but only the first digit of each number is shown. I don't know why this is happening, even though the data obtained has been processed correctly.
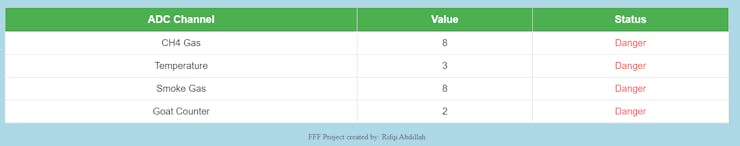
The data received is a string sent by the Arduino, then processed and parsed using commas. After that, the data is stored as a char in variables created for each piece of data on the SURF5 board. The data is then converted into a number/int using the atoi function. The data is then sent to be displayed in int form on the web server. However, it turns out that the converted data only shows the first digit of the number. For example, the received data for temperature is 32, but only the digit 3 is successfully converted. You can check the image below to see the error results I obtained.
Initially, I thought there was an error in data parsing. Therefore, I conducted various experiments, from adding delays, changing data parsing methods, to conducting other experiments on the Arduino board, which I suspected to be the cause of the issue. After various experiments, I found that the data stored as a char on the SURF5 board was indeed complete. For example, if the temperature data sent is 32, the data received is also 32.
However, when I displayed the data on the web server, not in integer form but directly in char form, something strange happened. The data displayed was "3 2" with a space separator between them, not "32". As a result, when I converted the data to integer form, only the first digit, 3, was successfully converted. This explains why only the first digit appeared on the web server.
To solve this problem, I created a function to remove spaces in the middle of the char. I named the function remove_spaces. The remove_spaces function is a function in the C programming language that aims to remove all space characters from the given input string. This function takes one argument, a pointer to a character (char* source), which is the string that will be modified in place.
Inside the function, two pointers i and j are initialized to point to the beginning of the source string. Pointer j is used to read each character in the string, while pointer i is used to write back non-space characters to the correct position in the string.
The function uses a while loop that runs until it reaches the null-terminator character ('\0') that marks the end of the string. Inside the loop, there is an if condition that checks whether the character pointed to by j is not a space, using the isspace function from the ctype.h library. If the character is not a space, the character is copied to the position pointed to by i, and then pointer i is moved to the next position. Pointer j always moves to the next position in each iteration of the loop.
After the loop is completed, the null-terminator character ('\0') is placed at the position pointed to by i, marking the end of the modified string. Thus, all space characters in the original string are removed, and the resulting string is stored in the same location as the original string.
void remove_spaces(char* source) {
    char* i = source;
    char* j = source;
    while(*j != '\0') {
        if(!isspace(*j)) {
            *i = *j;
            i++;
        }
        j++;
    }
    *i = '\0';
}
You can see the final result of the web server I created in the image below. This website clearly displays the data acquired from each sensor and sent using Arduino to the SURF5 board. The data is now accessible to the end user. Despite the many challenges faced during the development process, all these issues were successfully resolved.
Attachment
Attachment 5.1 : FFF Project Web Server Code
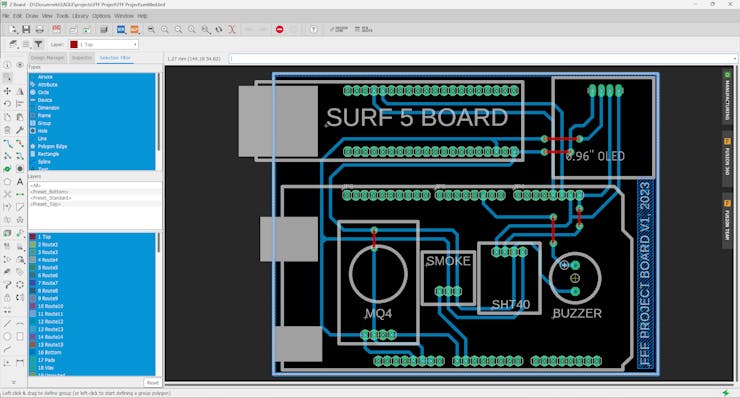
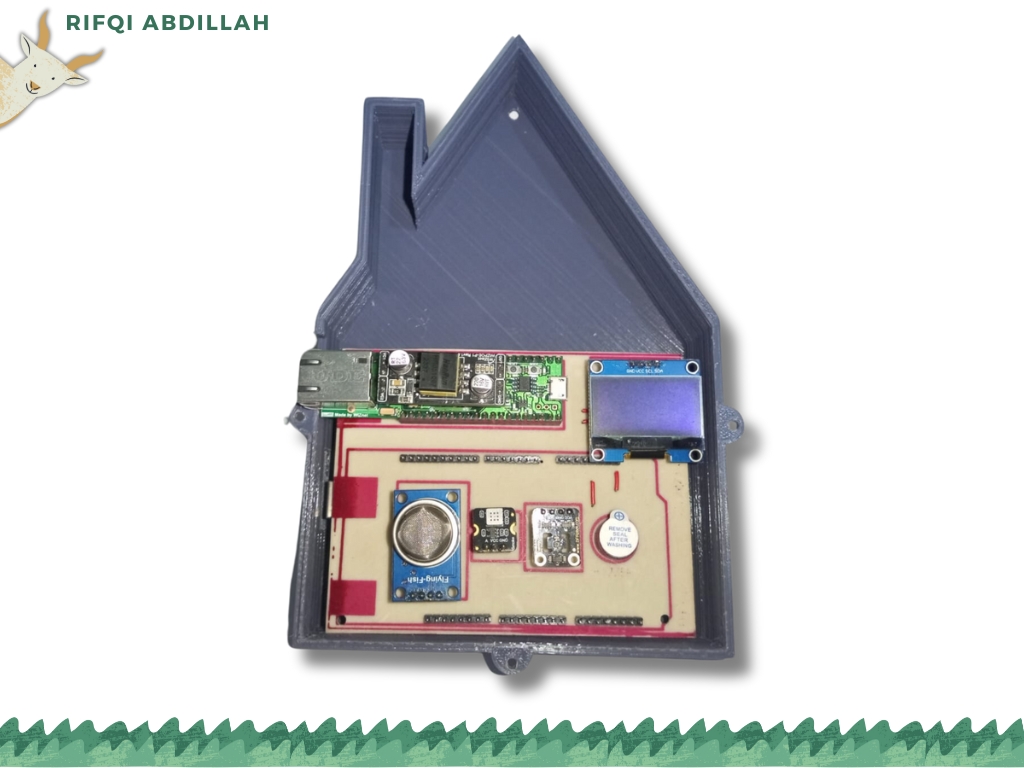
6. Designing and Fabricating Custom Printed Circuit Boards
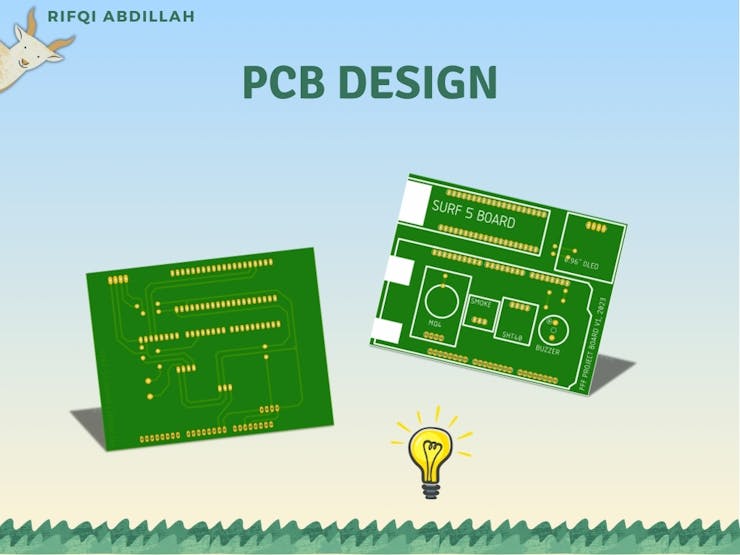
In developing this project, I decided to create a custom PCB to facilitate the device implementation process. This process begins with using Eagle, a PCB design software renowned for its efficiency in laying out electronic circuitry. The first stage involves designing the schematic, where I craft detailed circuit diagrams. To support this process, I've had to manually measure the SURF5 board I'm using due to the unavailability of a suitable library.
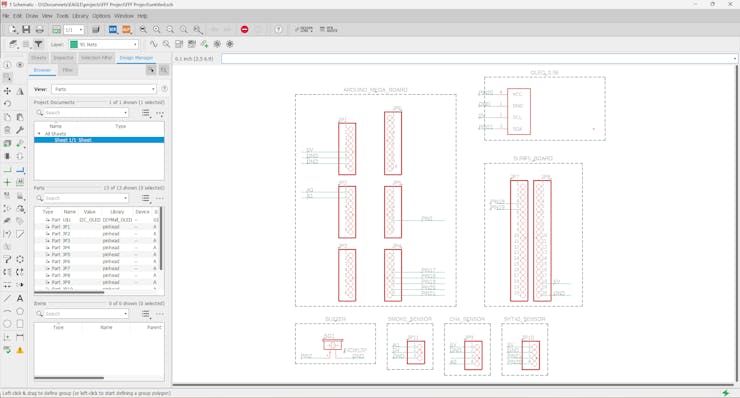
After completing the schematic design, the next step is to create the board layout. During this stage, I carefully arrange the positions of components to meet both functional and mechanical needs. The subsequent process involves PCB fabrication, which I've entrusted to a local PCB manufacturing service for production. Despite encountering some quality degradation due to certain limitations in the process, I'm pleased to report that the PCB board still functions well and meets all necessary requirements for this project.
The image below is the final result of the PCB that has been created, demonstrating commitment and dedication to ensuring that this solution operates optimally. The process of custom PCB fabrication has proven its value in optimizing the overall system performance
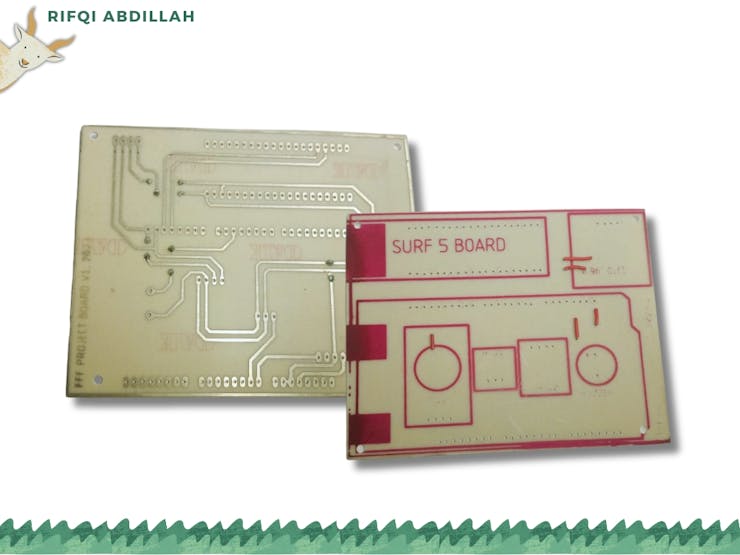
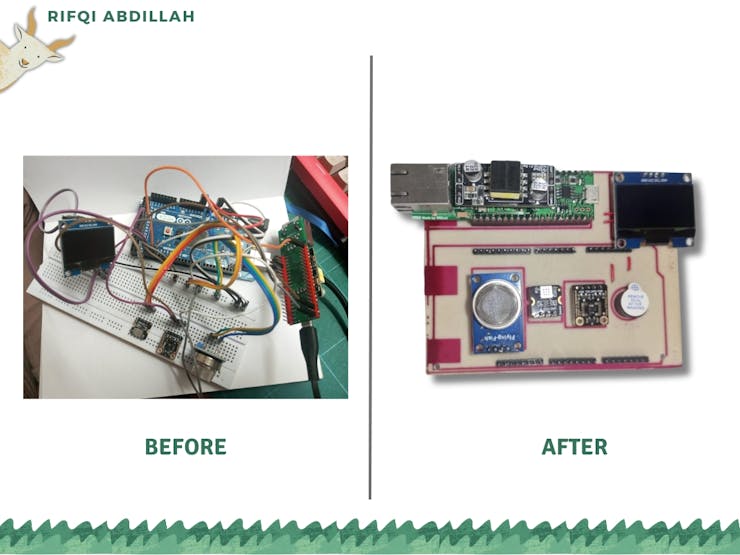
After attempting to install the headers used to connect the board module with the components intended for this project, here is the comparison before and after using the PCB.
Attachment
Attachment 6.1 : Schematic and Board PCB
Attachment 6.2 : Printable PCB file
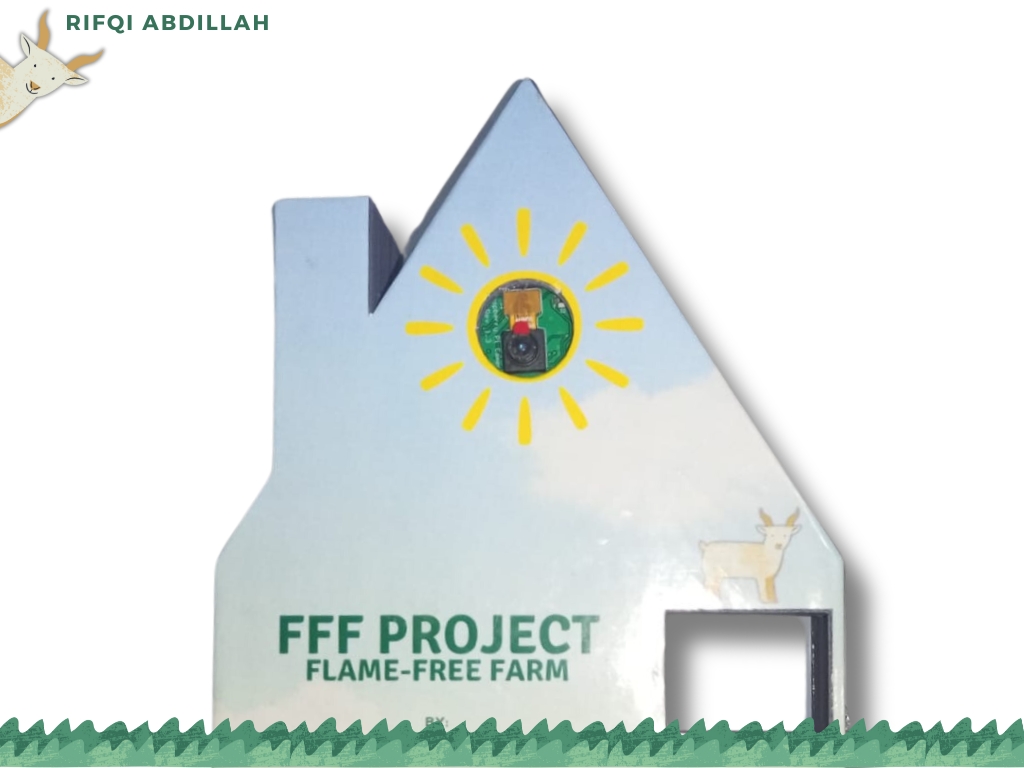
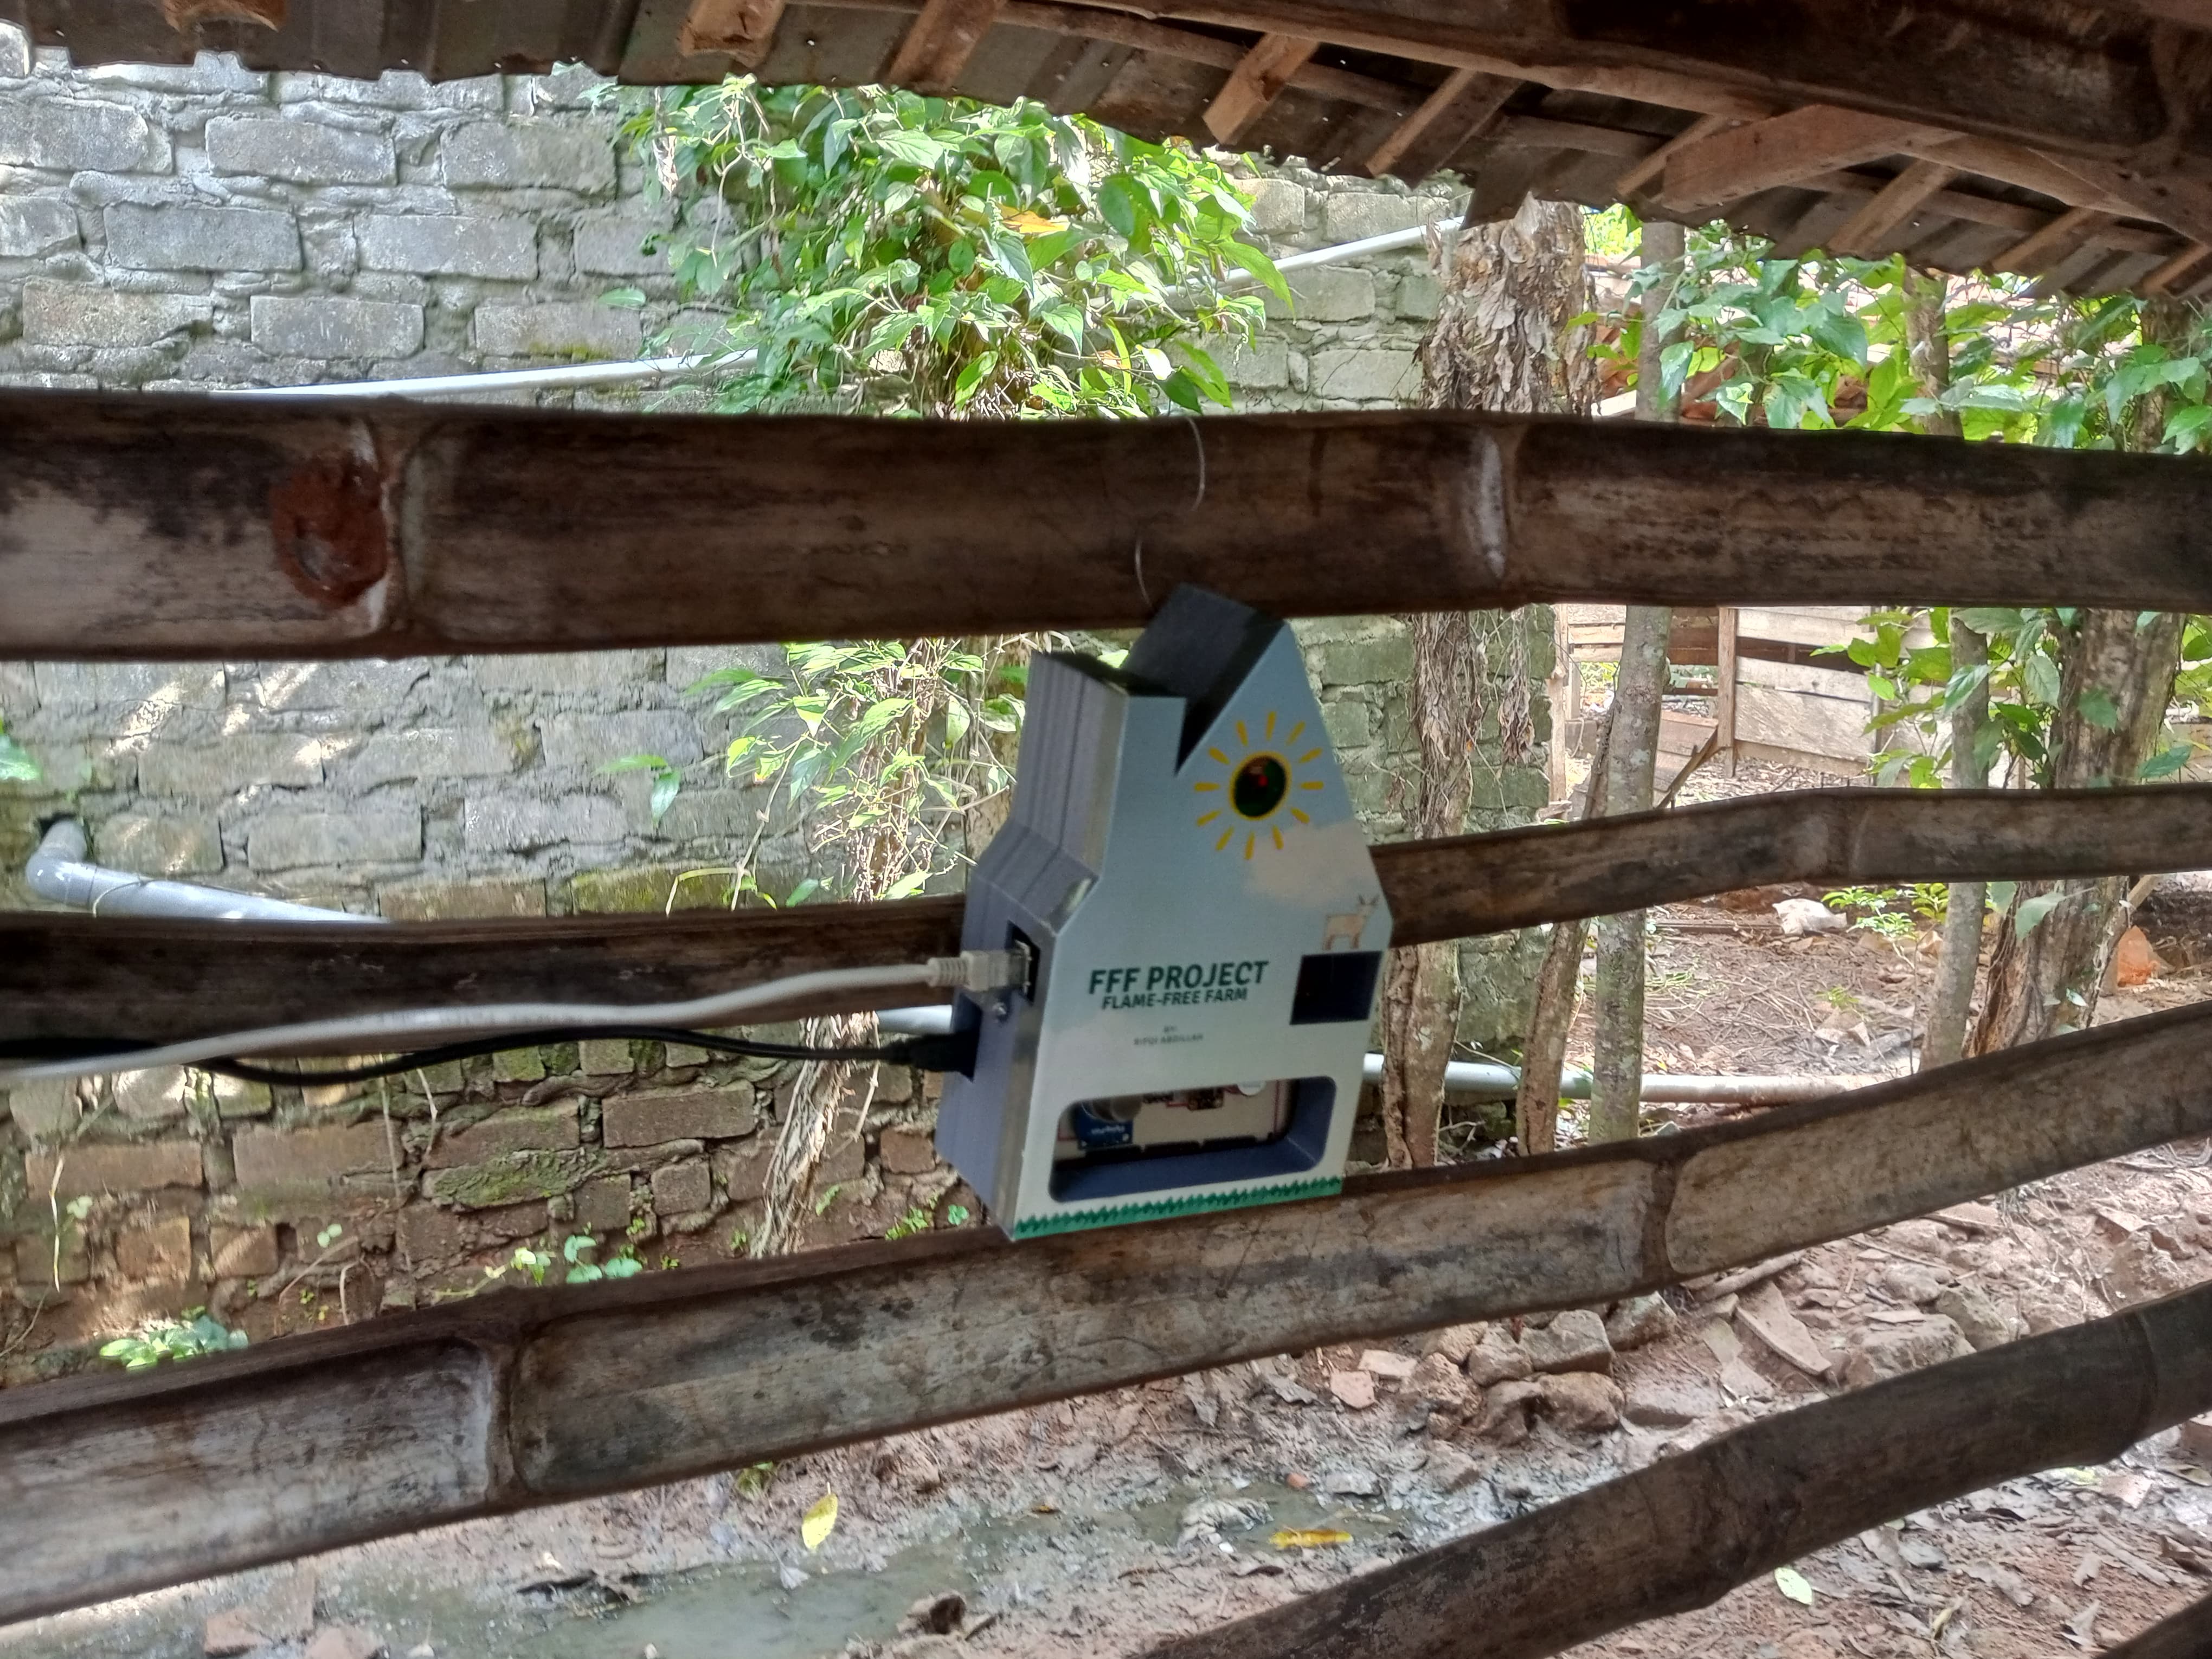
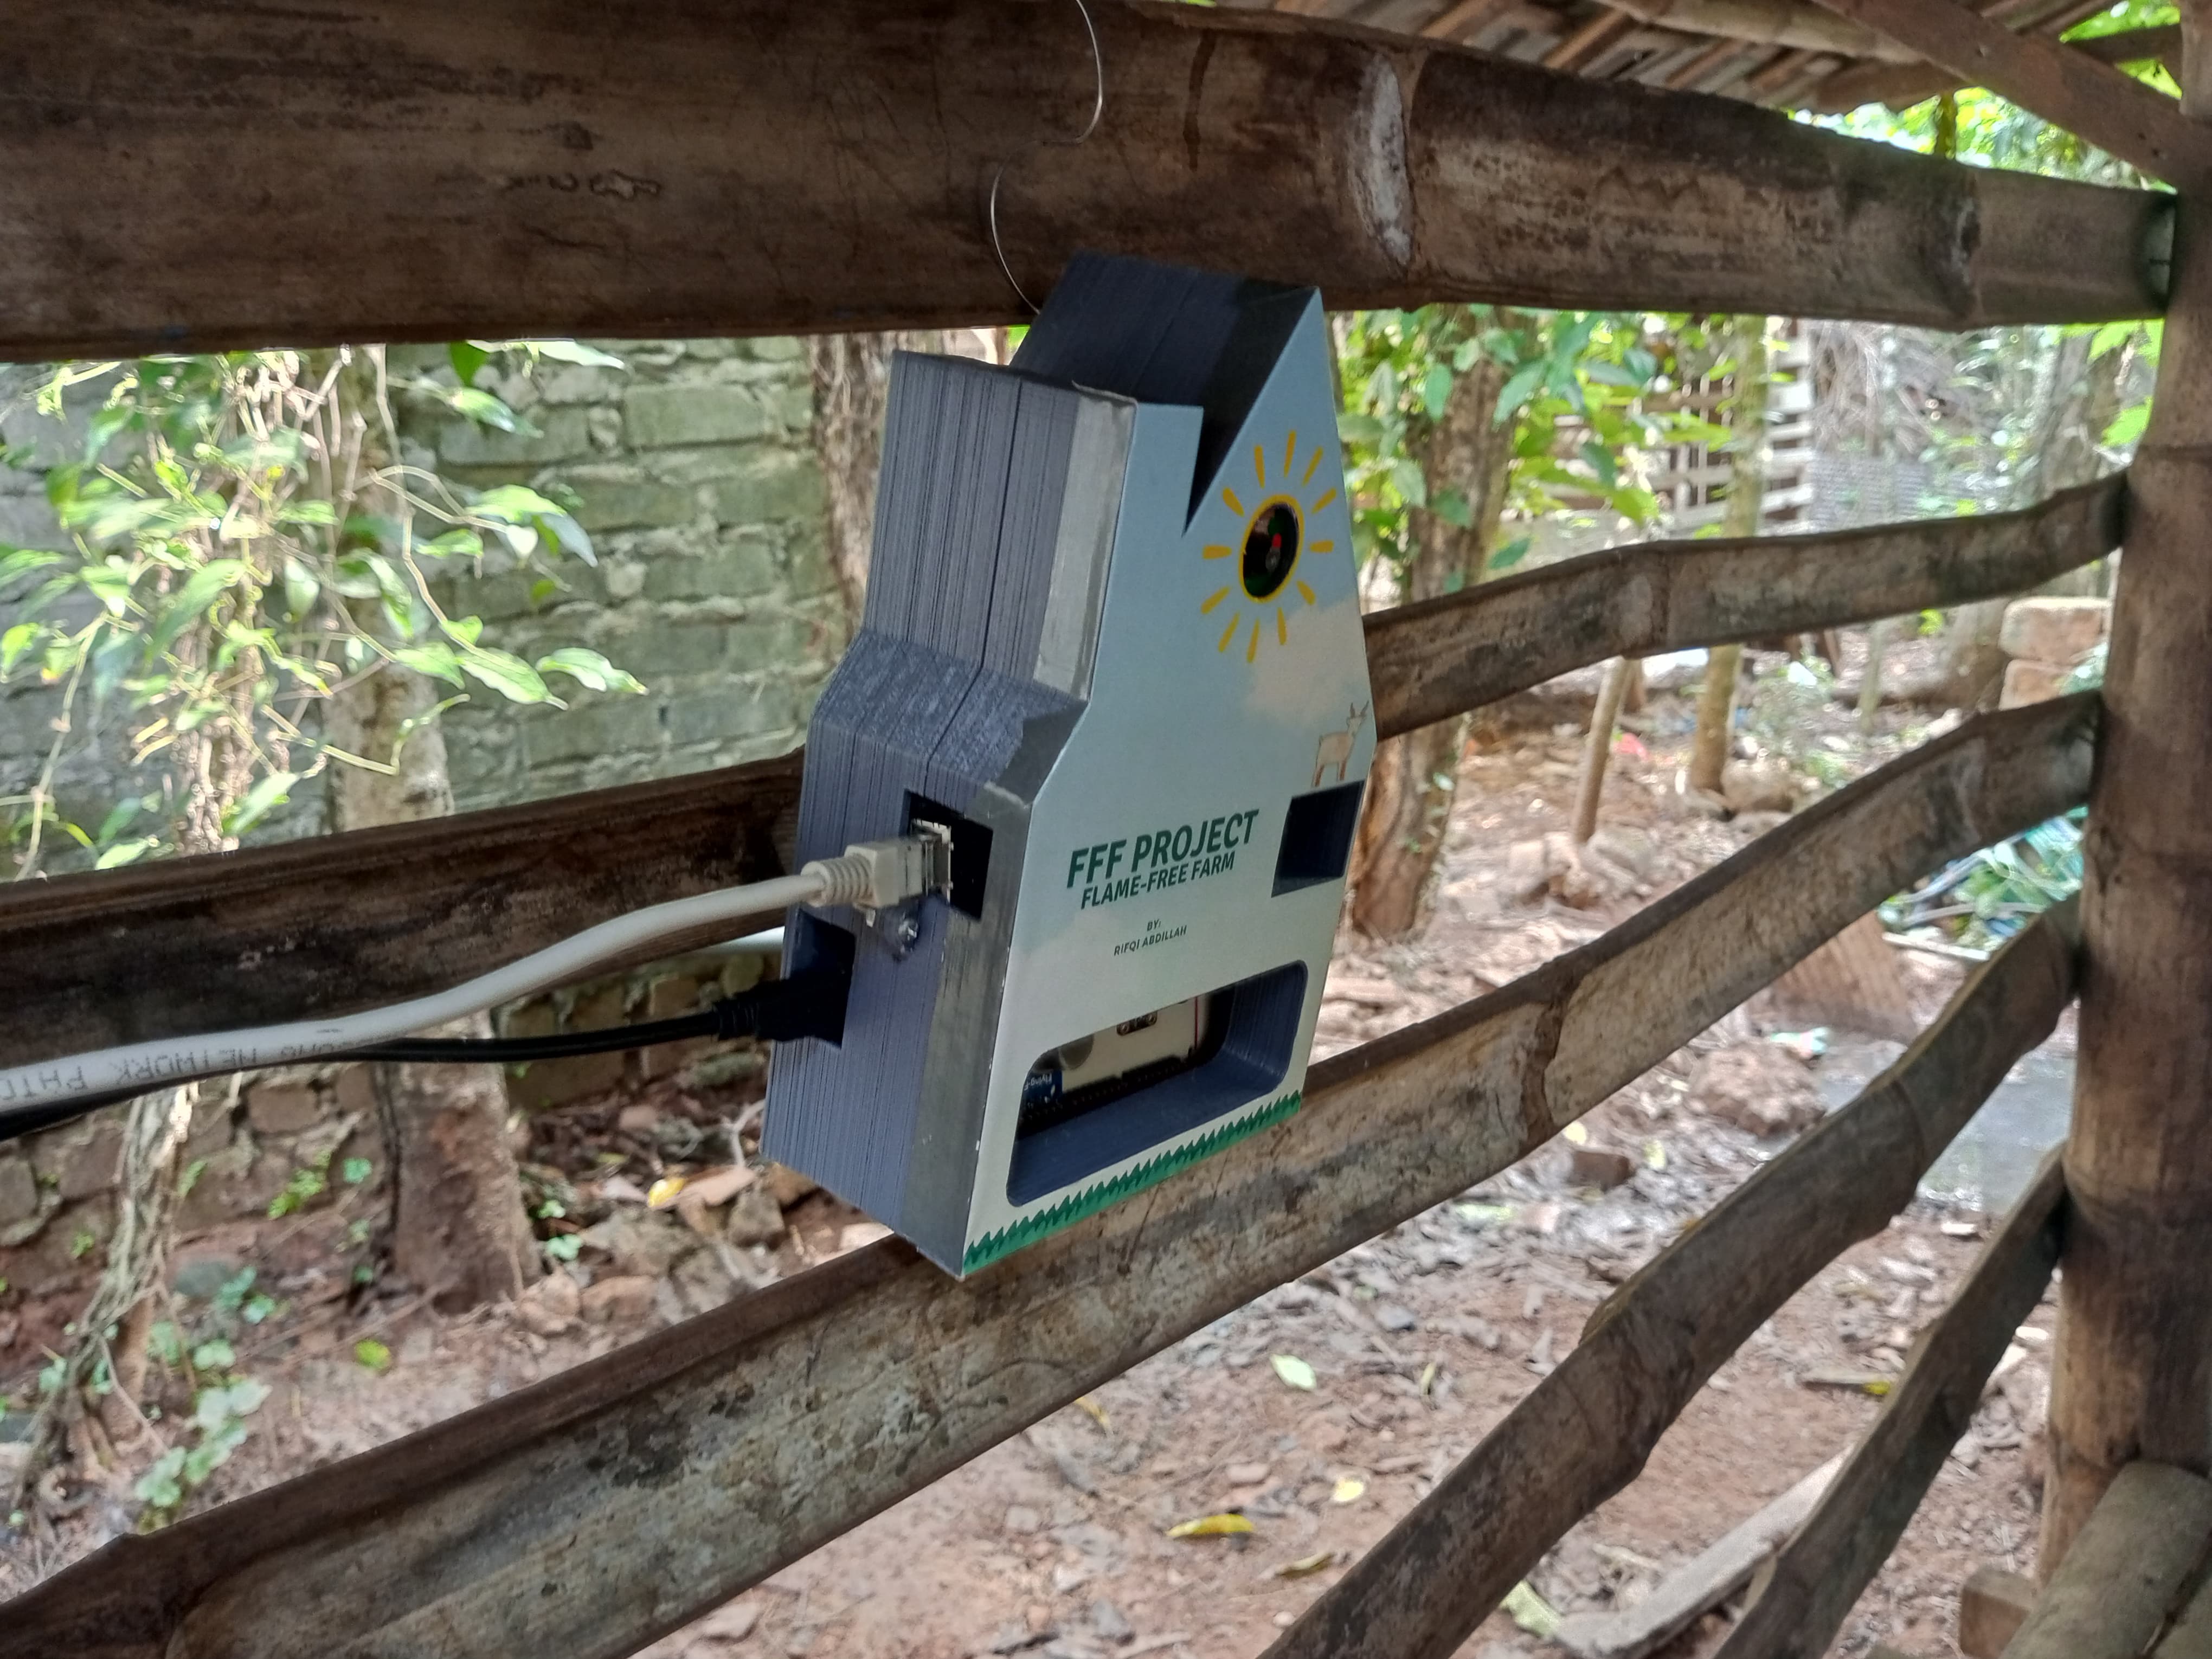
7. Designing Functional 3D-Printed Casings
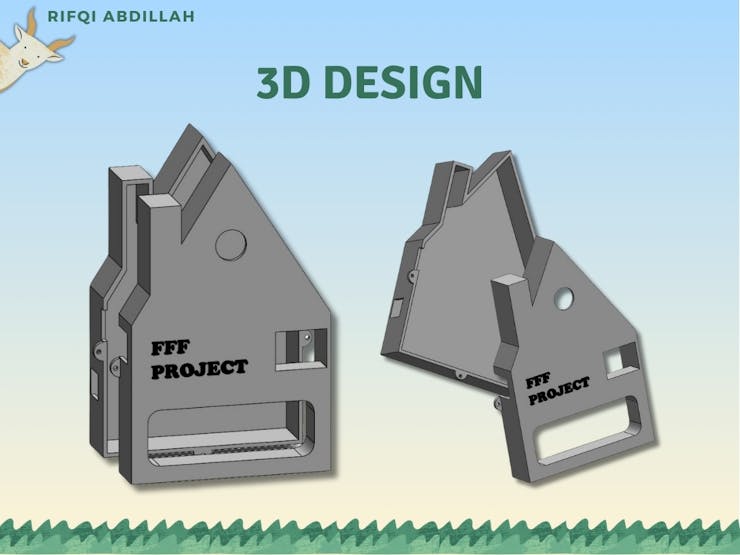
In this project, I designed and fabricated a custom casing using 3D printing technology. The design process began with creating a 3D model using SolidWorks software. This application enabled me to develop accurate and detailed models, which are crucial to ensure that the resulting casing meets the requirements. The initial step involved meticulously measuring the previously made board. These precise measurements formed a crucial basis to ensure that every dimension of the casing would fit perfectly with the existing components.
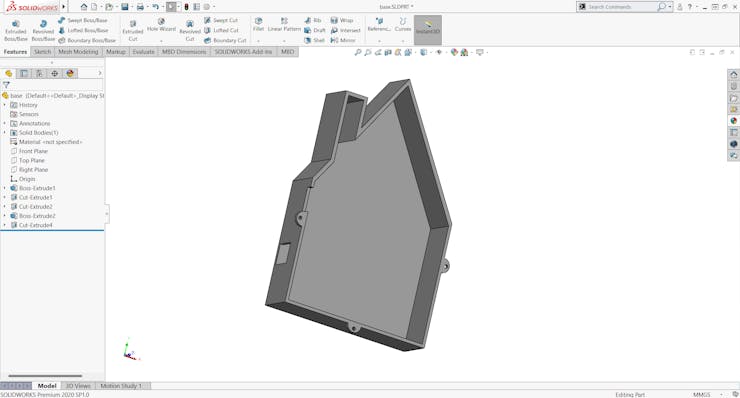
After taking measurements, I proceeded to create part files in SolidWorks. Each part was designed meticulously, considering every detail and dimension previously measured. This process involved creating several part files, which were then assembled into a single assembly file. The assembly file was used to verify fit and ensure there were no design errors. Using SolidWorks assembly features, I could observe how each part interacted with one another, ensuring no components collided or misaligned.
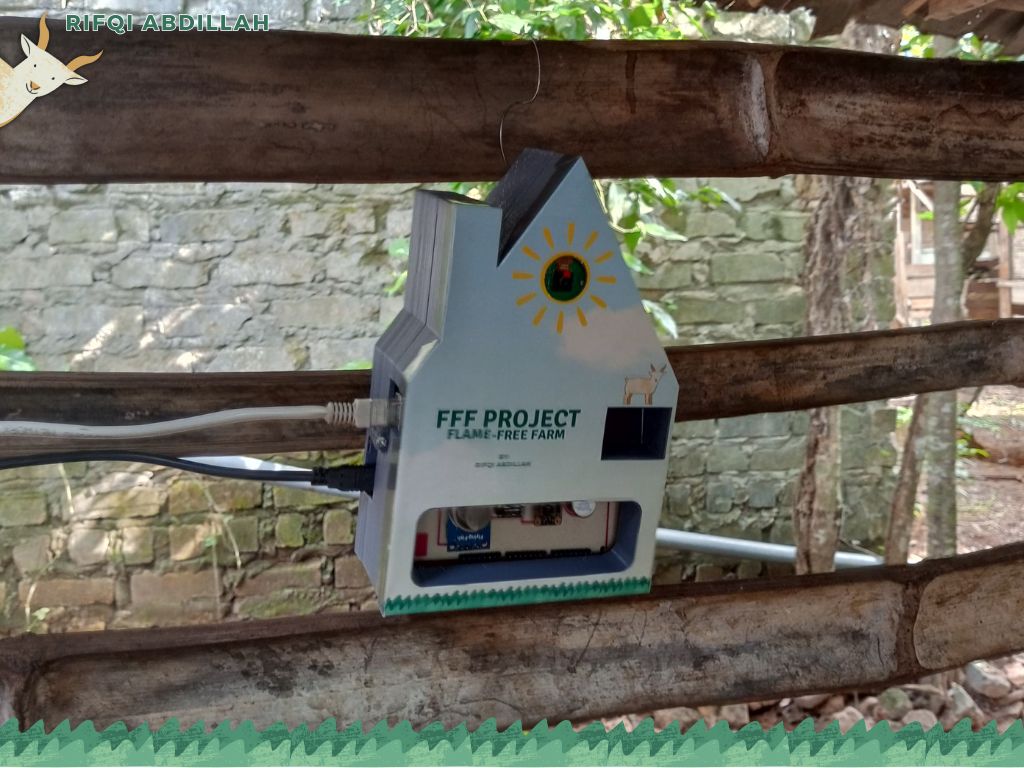
Once I confirmed the design was correct and error-free, the next step was to print the design using a 3D printer. This printing process transformed the digital design into a physical product ready for use. The 3D printer precisely printed each part according to the designed specifications. The printed parts were then assembled to form the casing as per the desired specifications. Thus, the custom casing production process was successfully completed, from design through to production using 3D printing technology.
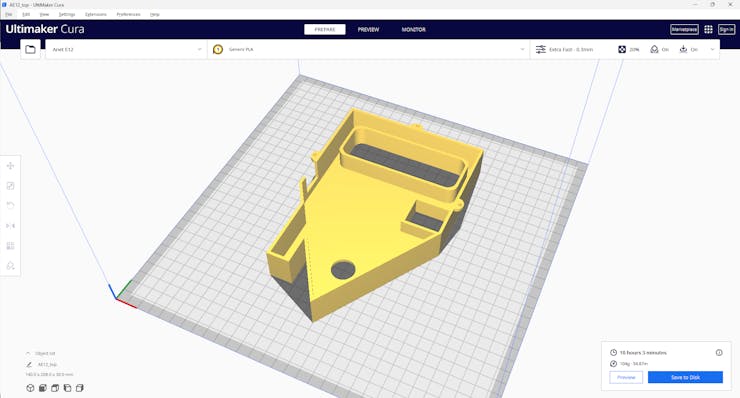
The files ready for printing will be saved in .stl format, which is a 3D file format. Next, the files will be sliced using Ultimaker Cura software. This process will generate files ready to be loaded into the 3D printer. As you can see, for just one part of the case, I spent 10 hours waiting for it to finish, and for two files, I needed more than 20 hours of printing time
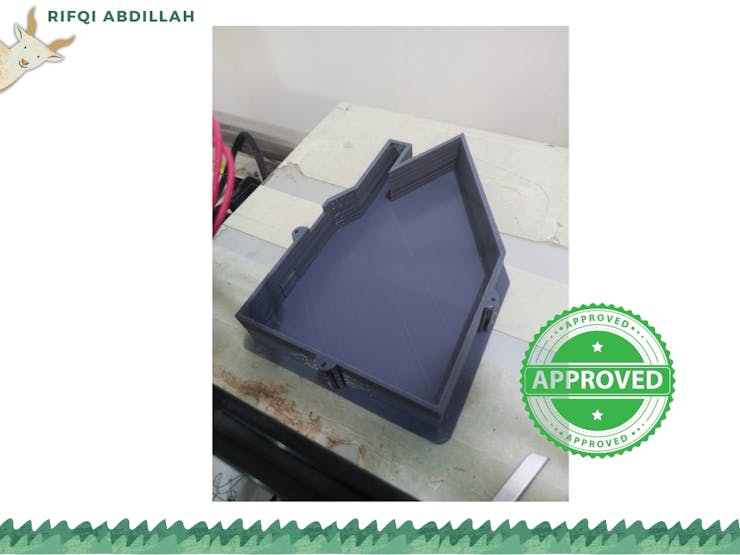
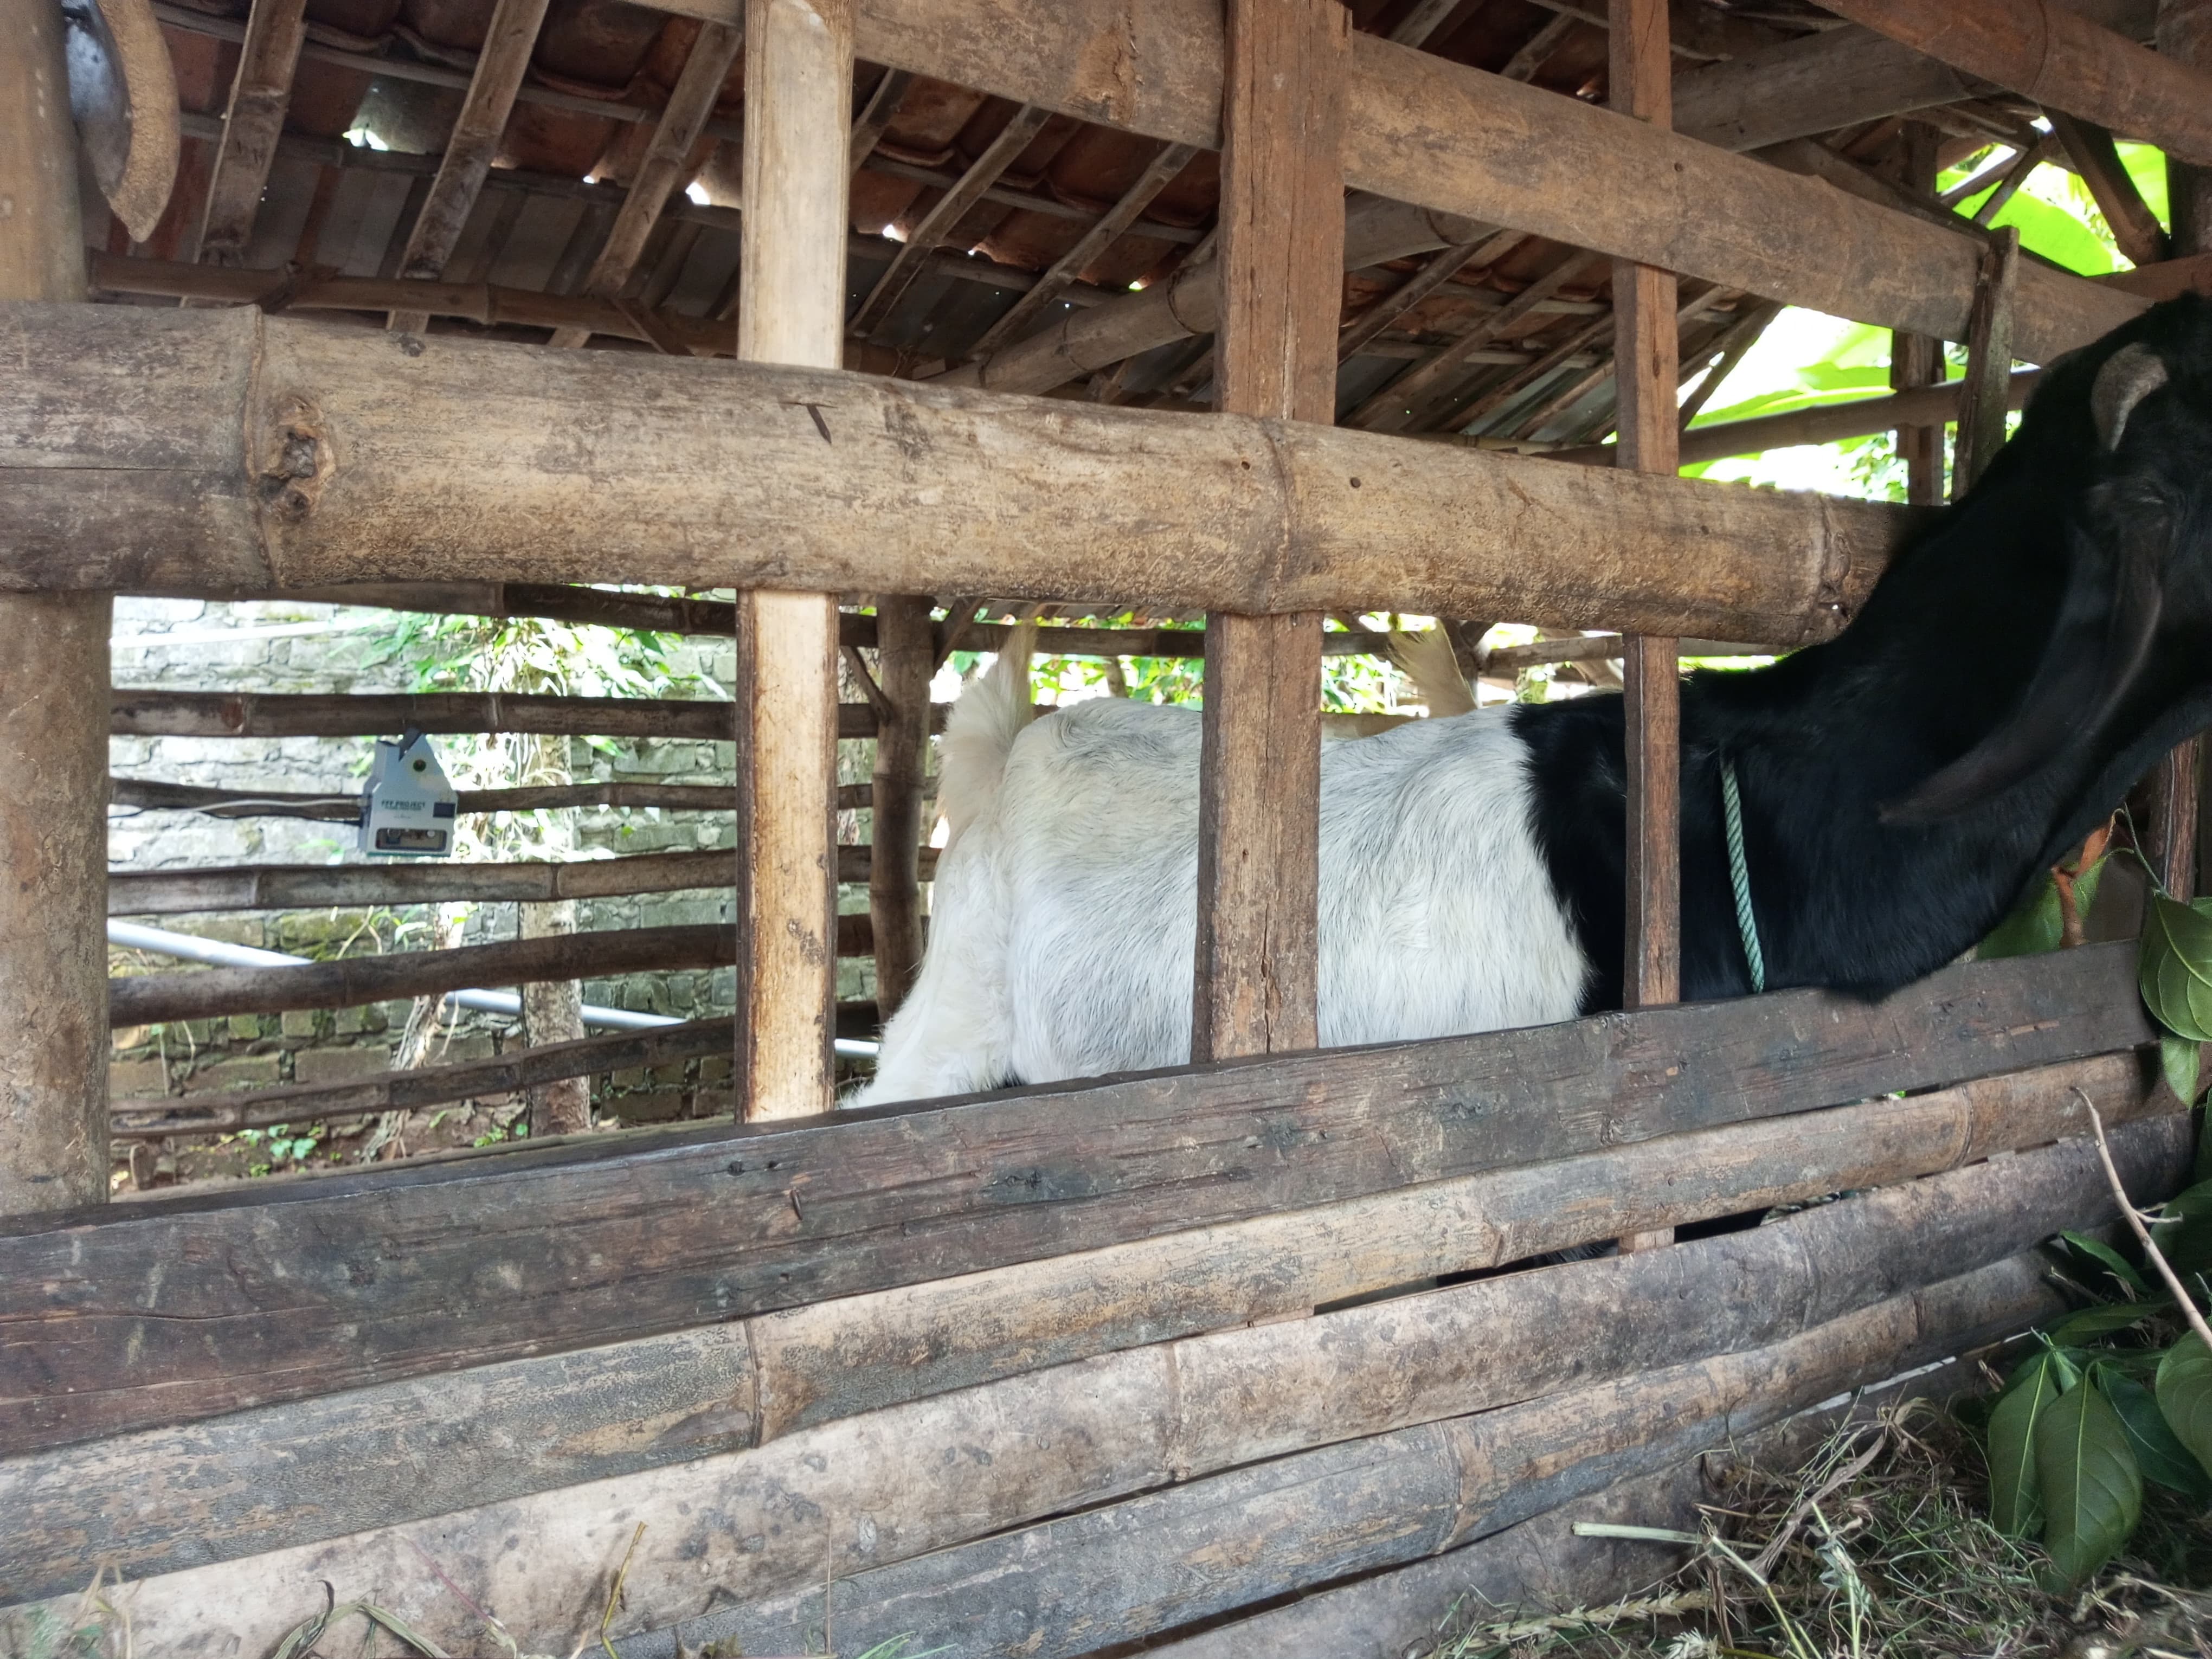
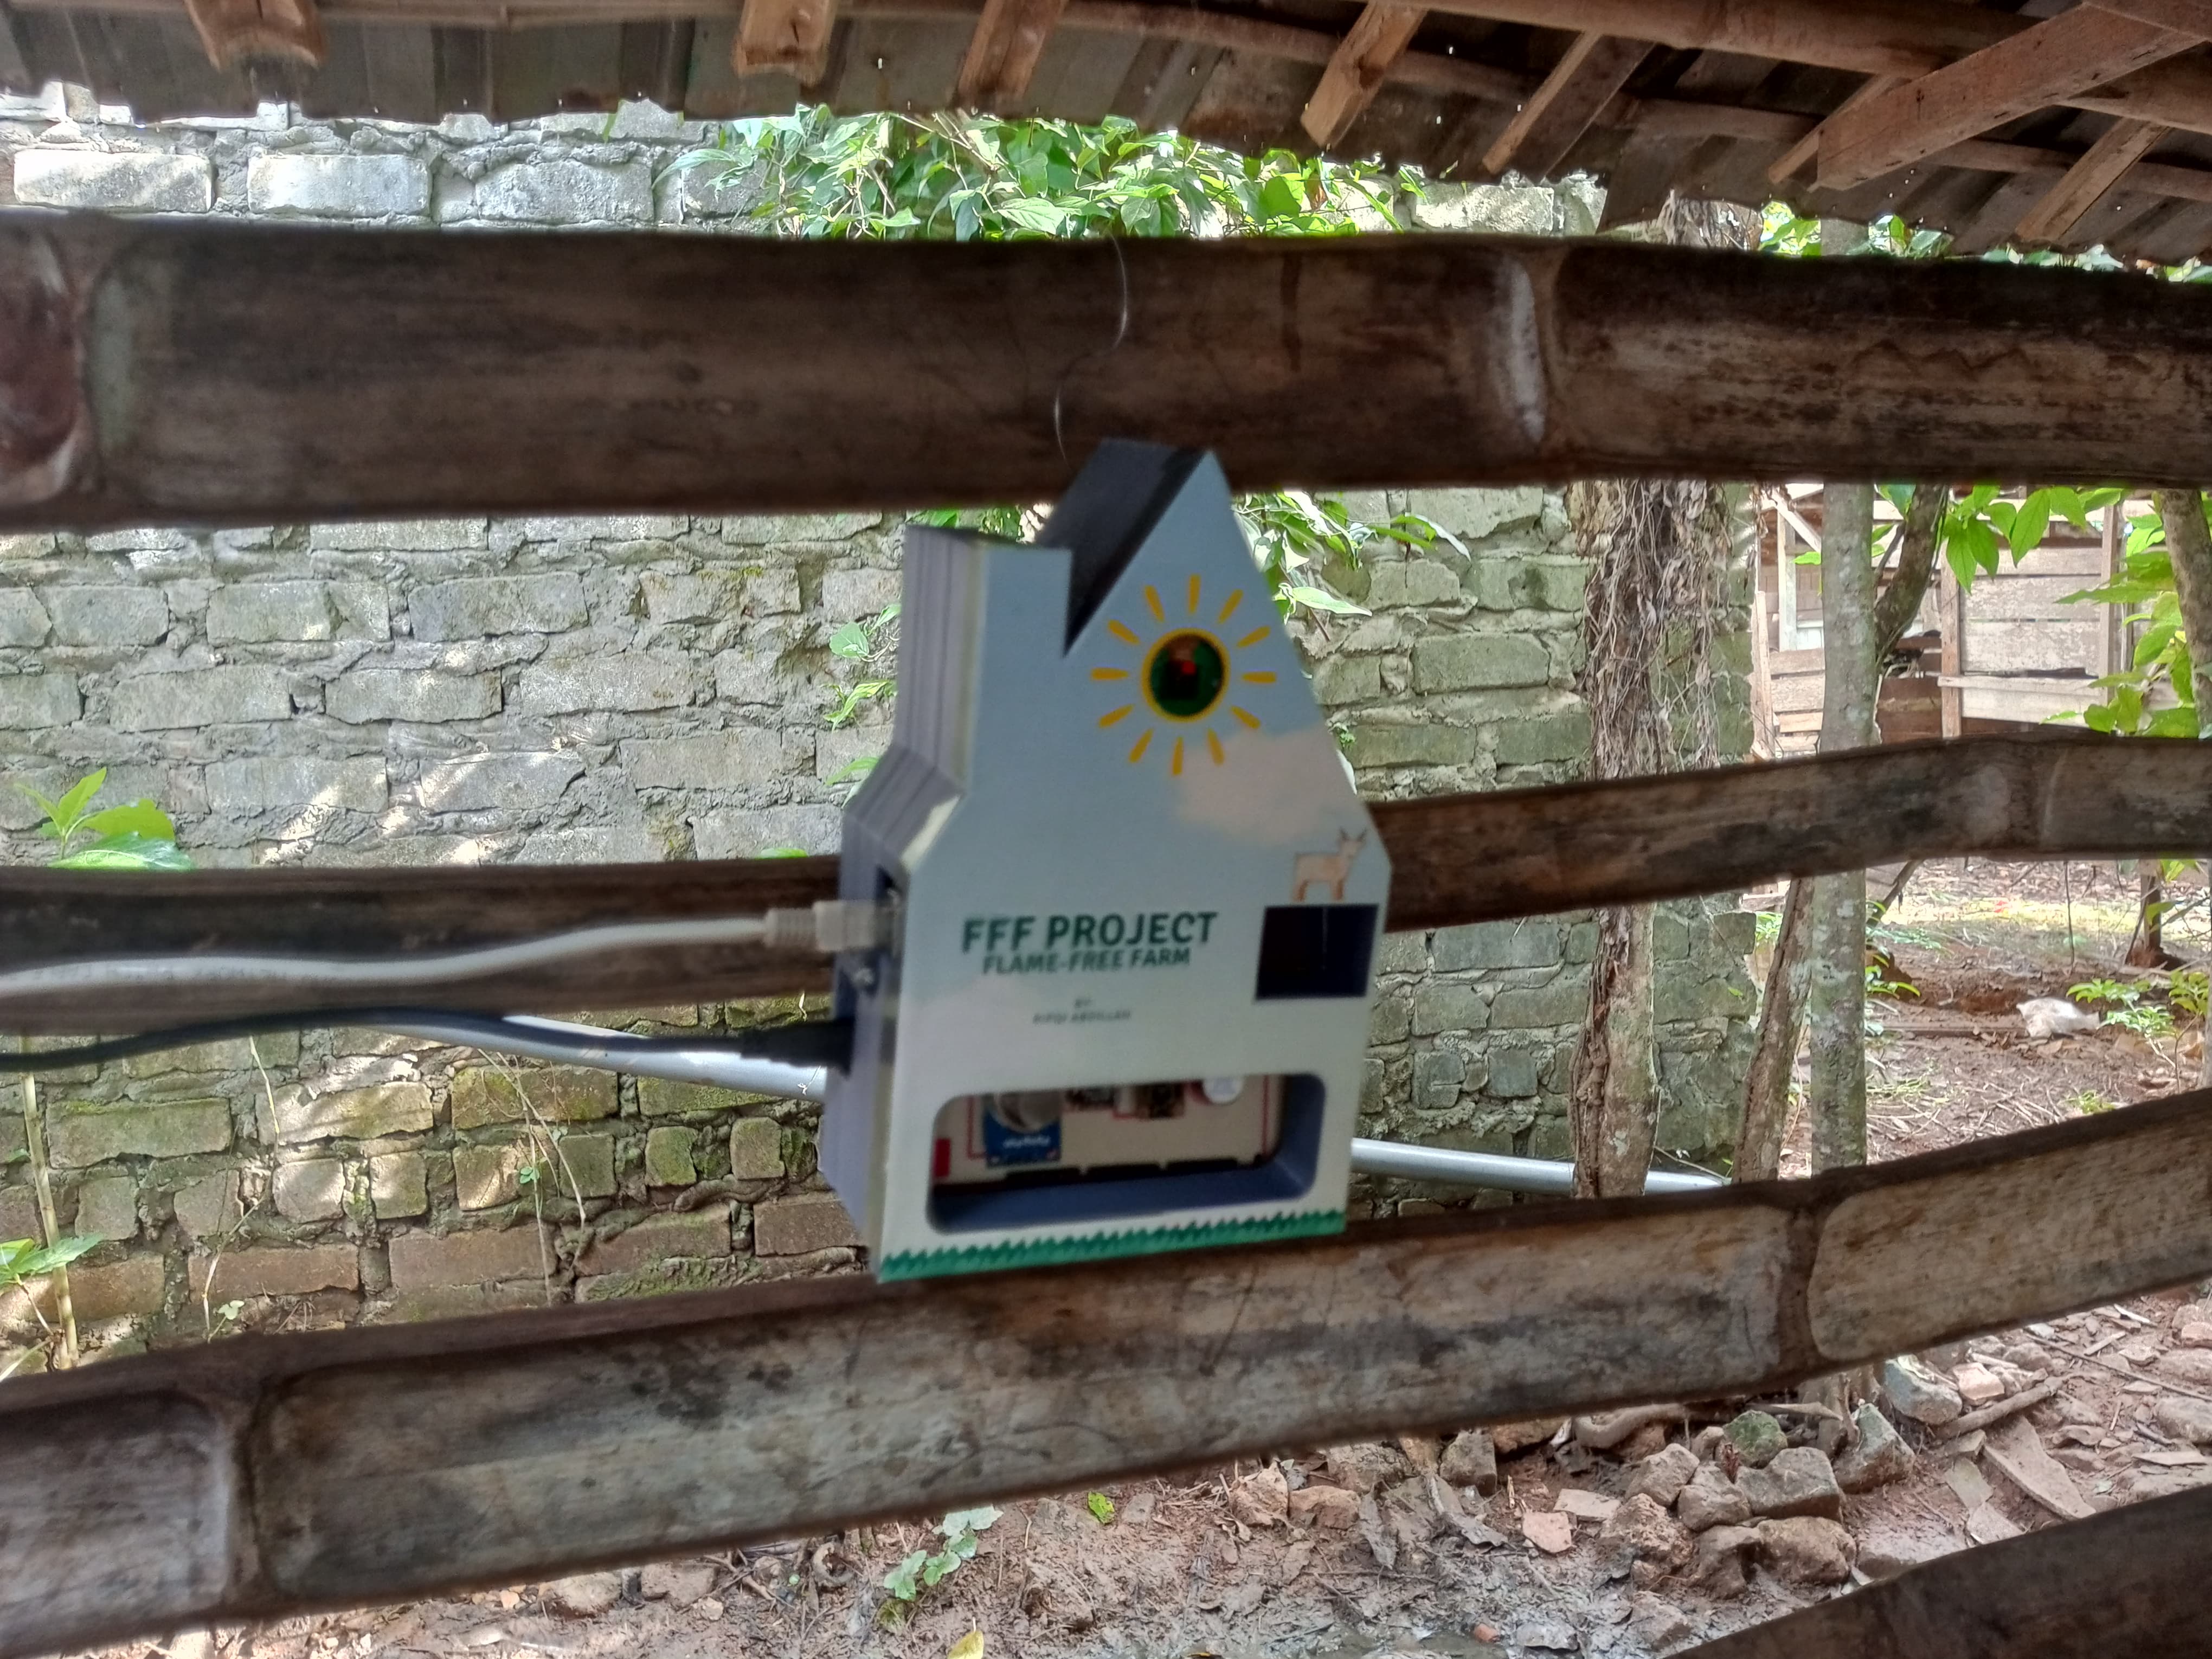
After a total of 20 hours, here are the results of the casing we designed and printed. This casing will be used as a cover for the device we created to enhance safety and aesthetics. The lengthy printing process underscores the importance of planning and time management in 3D component manufacturing projects. In addition to providing physical protection, this casing also enhances the aesthetic value of our device. Through the use of 3D printing technology, we can create precise designs tailored to the specific needs of our device. The final outcome not only serves as a protector but also enhances the overall appearance of the device, demonstrating how 3D technology can transform ideas into reality with high efficiency and precision.
Attachment
Attachment 7.1 : 3D Design Casings
Attachment 7.2 : STL Printable File
Attachment 7.2 : Sticker for The Casing
8. System Testing
We have gone through many intricate yet fascinating processes. Starting from testing sensors, communicating between two boards using our own designed methods, creating models to calculate the number of goats, setting up a web server for monitoring barn conditions, to designing custom PCBs and casings to protect our project from dust and enhance its aesthetics. Finally, let's try and test everything we have worked on. Please watch the video below to witness the entire process we have gone through up to this point.
Closing from the makers
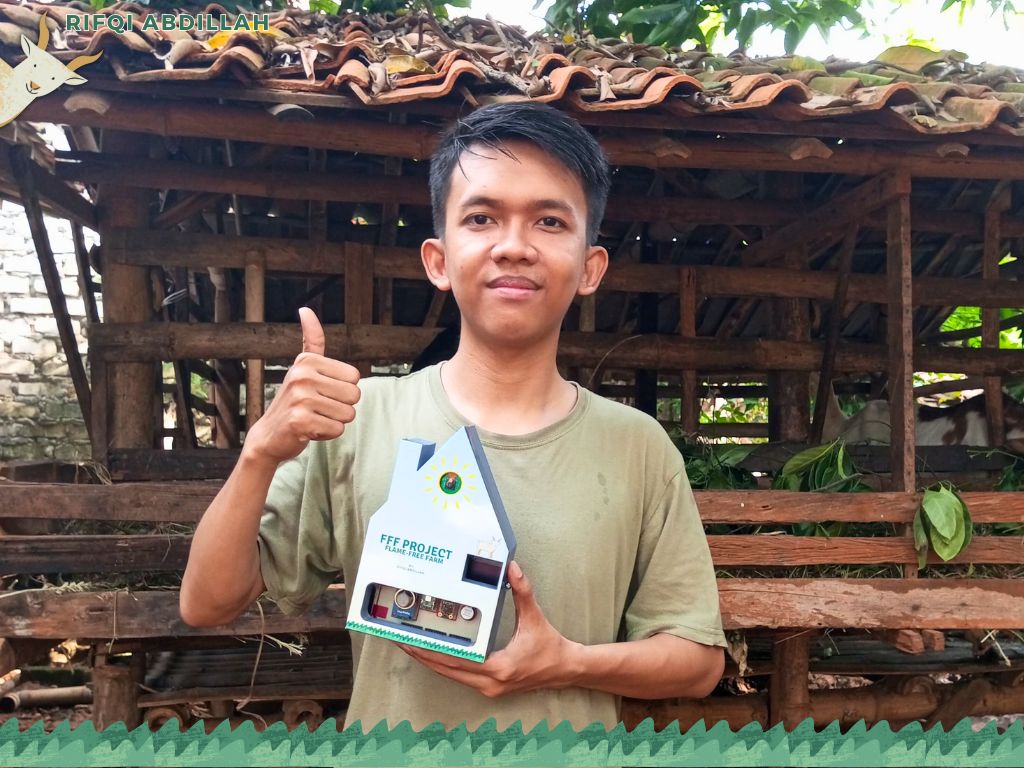
The FFF Project, Flame-Free Farm, is an innovative IoT solution designed to enhance farm safety and prevent fires by alerting farmers to potential risks. Utilizing various sensors including the MQ4 methane sensor, SHT40 temperature sensor, smoke sensor, and Grove Vision AI v2 for goat counting, this system provides comprehensive monitoring of critical environmental parameters. The collected data is transmitted to a web server built using the SURF 5 board, enabling remote monitoring. The system has been successfully implemented and is currently operational, ensuring early detection of fire hazards and improving farm security.
Moving forward, the FFF Project aims to further improve and expand its capabilities. Future developments may include integrating additional sensors for more comprehensive environmental monitoring, enhancing the accuracy of goat counting features, and improving the web server interface for a better user experience. Additionally, exploring the use of machine learning algorithms to predict fire hazards based on historical data could provide more proactive fire prevention measures. This project envisions a scalable solution adaptable to various farm sizes and types, ensuring more farmers can benefit from this innovative technology.
By reducing fire risks and enhancing livestock safety, the FFF Project enables farmers to focus on productivity without constant worry about potential hazards. This increased sense of security is expected to lead to more efficient farm operations and greater peace of mind for farmers. In turn, this can contribute to higher productivity and sustainability in the livestock sector, ultimately benefiting the economy and the environment.
-
FFF Project Source Code

-
FFF Project Shematic PCB Design
-
FFF Project 3D Design Casing
-
FFF Project Goat Dataset
-
FFF Project Machine Learning Model for Counter