
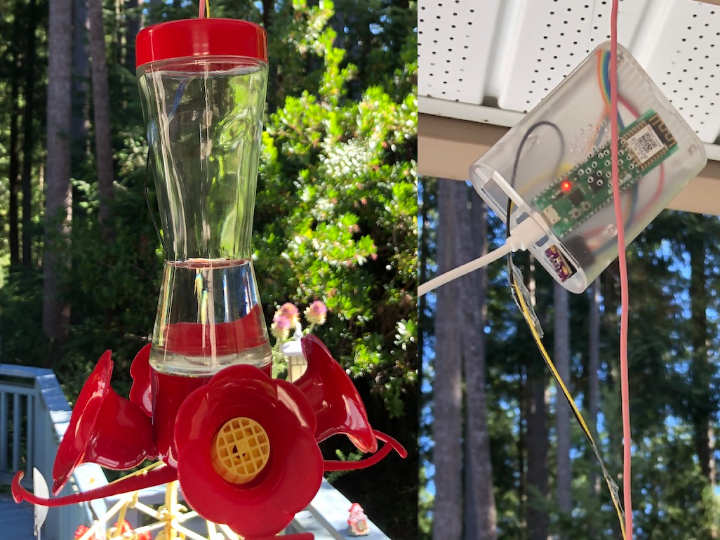
Hummingbird Feeder Monitoring
Using the WizFi360-EVB-Pico to track the temperature of my hummingbird feeder nectar, and the outside temperature near it.
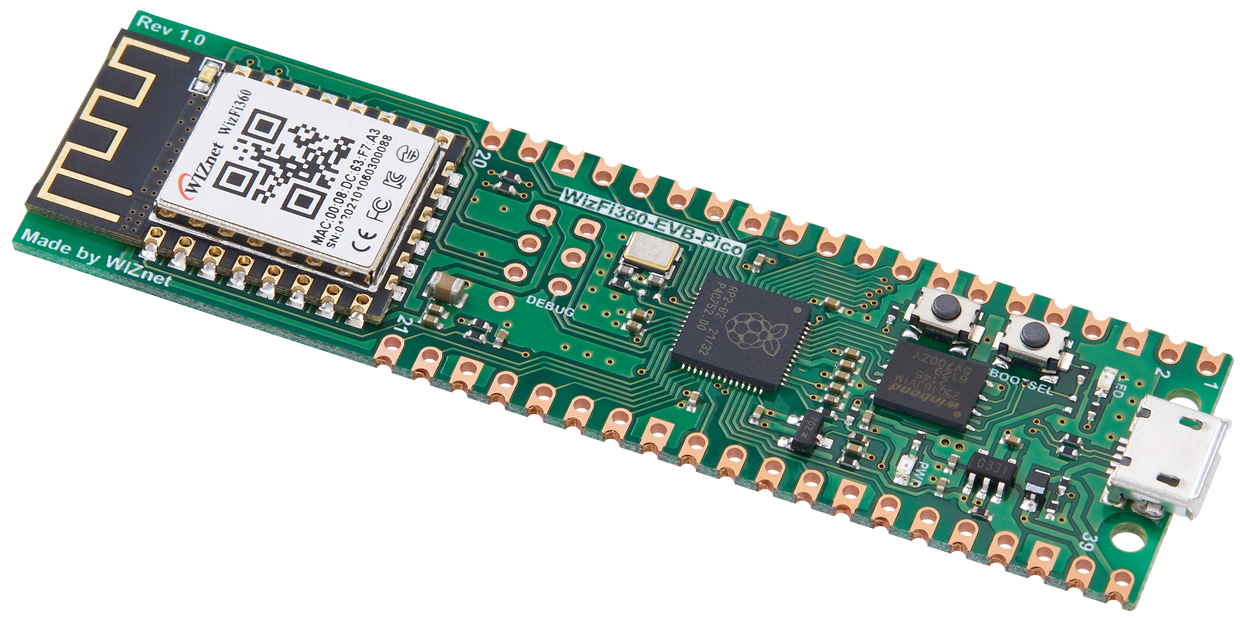
WIZnet - WizFi360-EVB-Pico
x 1
Main IoT microcontroller
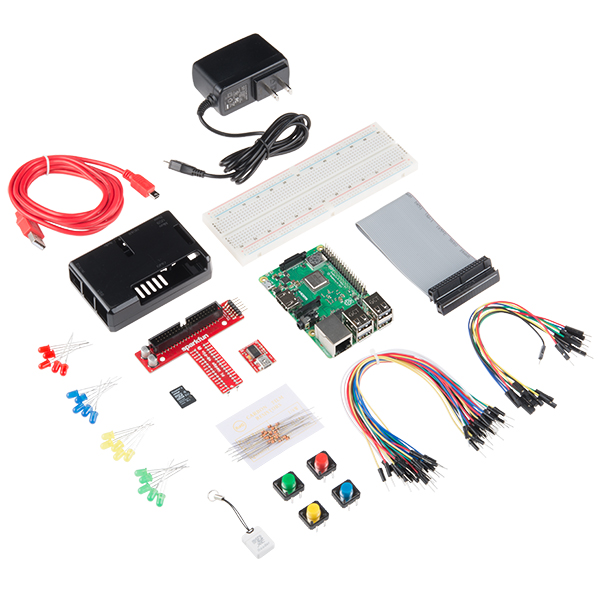
sparkfun - Raspberry Pi 3 B+ Starter Kit
x 1
Any Raspberry Pi should work, to use as the server

dfrobot - Gravity: I2C BME280 Environmental Sensor
x 1
I used a generic BME280, using SPI

node-red - Node-RED
x 1
Visual logic programming on Raspberry Pi

Arduino - Arduino IDE
x 1
Arduino IDE
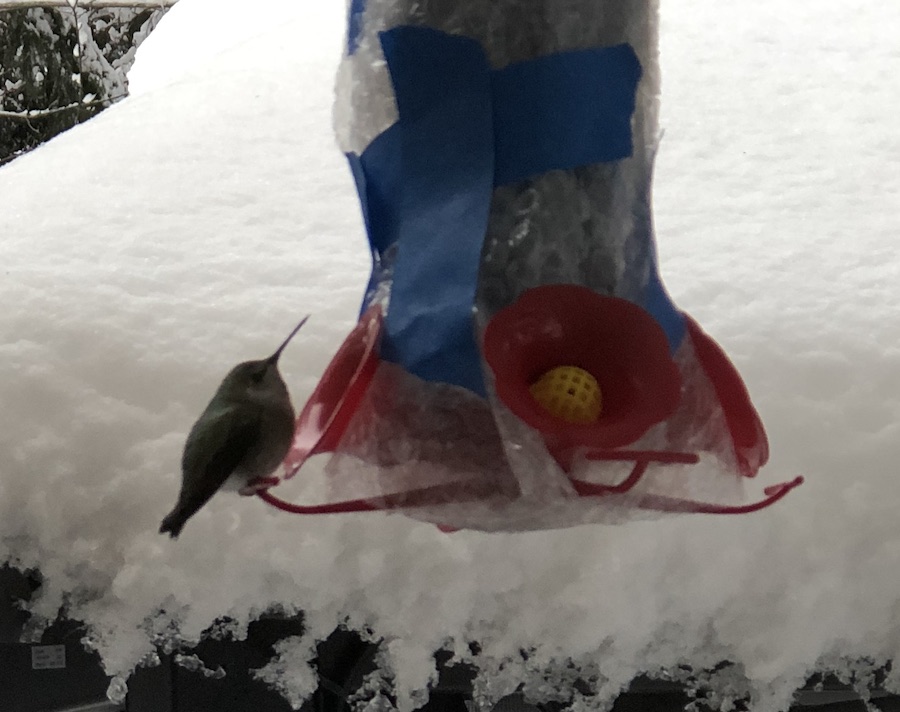
I live on Vancouver Island (BC, Canada), where we have a lot of Anna’s hummingbirds that overwinter and depend on hummingbird feeders to get through the more difficult times of winter.
We do get snow and freezing temperatures, so it can be a challenge to keep the hummingbird feeders from freezing at times.
I’ve been using USB-powered hand-warmers, controlled with bi-metal temperature switches, to automatically keep them warm. This generally works well, but the temperature can swing a fair bit, so I want to monitor the temperature to make sure it doesn't get too warm or too cold.
To easily keep an eye on the nectar temperature, and to make sure the heater setup works properly, I will use the new WizNet WizFi360-EVB-Pico with dual temperature sensors to track the hummingbird feeder nectar temperature, and the temperature of the outside air nearby. As a bonus, one of the sensors I’m using also gathers pressure and humidity data.
I’m intending for the main focus of this Project to be on the WizFi360-EVB-Pico, but because it needs the Raspberry Pi Server for it to work, I will also need to spend some time to describe how the server needs to be set up. The installation itself is general, but after installation it requires some programming for our project.
Programming the WizFi360-EVB-Pico: Getting Started
At this point (September 2022), the easiest way to program the WizFi360-EVB-Pico board is with the Arduino IDE.
The nice thing is that the WizFi360-EVB-Pico board is exactly the same as a regular Raspberry Pi Pico, with the exception that a WizFi360 module has been connected to a few of the pins. This means we can program the board with the Arduino IDE by simply programming it in the same way we would program a Raspberry Pi Pico.
The first step is to add support for the WizFi360-EVB-Pico board - See https://github.com/earlephilhower/arduino-pico and follow their directions. The Wiznet website will likely also have some excellent tutorials to help you get set up.
Adafruit has a great tutorial to help you with that too: https://learn.adafruit.com/rp2040-arduino-with-the-earlephilhower-core/installing-the-earlephilhower-core
Basically just add the URL to the Arduino IDE Preferences, and then install their board support in the Boards Manager.
After that setup is done, you can then select the “WIZnet WizFi360-EVB-Pico” from the Tools-Board menu after choosing the submenu for “Raspberry Pi RP2040 boards”
With this done you can now program the WizFi board in the same way as a Raspberry Pi Pico. I suggest creating and running the Blink example to begin with.
Please pay attention to their note on the GitHub page under “Uploading Sketches”: “To upload your first sketch, you will need to hold the BOOTSEL button down while plugging in the Pico to your computer. Then hit the upload button and the sketch should be transferred and start to run.”
That gets things set up, but afterwards you can just choose the port and it behaves like any other Arduino board. I’ve found that it did sometimes require restarting with the BOOTSEL button pressed, but that’s a quick and simple process.
To add support for the WizFi360 WiFi module, you will need to install this library:
https://www.arduino.cc/reference/en/libraries/wizfi360/
You can do this in the Arduino IDE by choosing Tools-Manage Libraries, and then search for “WizFi”. Then click the “Install” button for the WizFi360 library.
The WizFi360 module is connected in a way similar to adding a plug-on hat module, and communication with the module is done via a simple serial port that gets set up in the sketch.
Programming the WizFi360-EVB-Pico: Reading the Temperature Sensors
At the core of this project is the need to measure temperatures, so let’s start with that.
I’m using a BME280 sensor to gather the outdoor temperature, pressure, and humidity, and I’m using a thermistor to read the nectar temperature. The thermistor is placed up against the outside of the glass hummingbird feeder bottle, under an insulating sleeve. The BME280 will be located near the hummingbird feeder, but under an overhang to protect it from rain.
Note that the WizFi360 module is connected to pins GPIO 4, 5, 6, 7, 20, 24, 25, and 29, so we will avoid connecting our sensors to those pins.
I chose to use Software SPI to communicate with the BME280 sensor, connecting it to the following pins:
BME280 -- WizFi-EVB-Pico
GND -- GND
VCC -- 3v3, but use GP14 so that we can toggle power to reset the BME280 if needed
SCL -- GP13
SDO -- GP12
SDA -- GP11
CSO -- GP10
I used a GPIO pin to provide power, rather than just using a Vcc(3v3) power pin, to allow resetting the sensor if it fails to start up, by toggling the power pin low and back to high. You might want to start by just using the 3v3 pin to make sure the BME280 sensor works, and then switch to using the GP14 power pins once it has been verified.
In the sketch you can see it defined to be pin GP14.
#define BME_POWER 14
This then allows us to use a test sketch just to read the temperature, humidity, and pressure from the BME280 module, and display it to the serial console that's part of the Arduino IDE. I've attached the sketch I used for testing: WizFi_BME280_temp_sensor_test.ino.
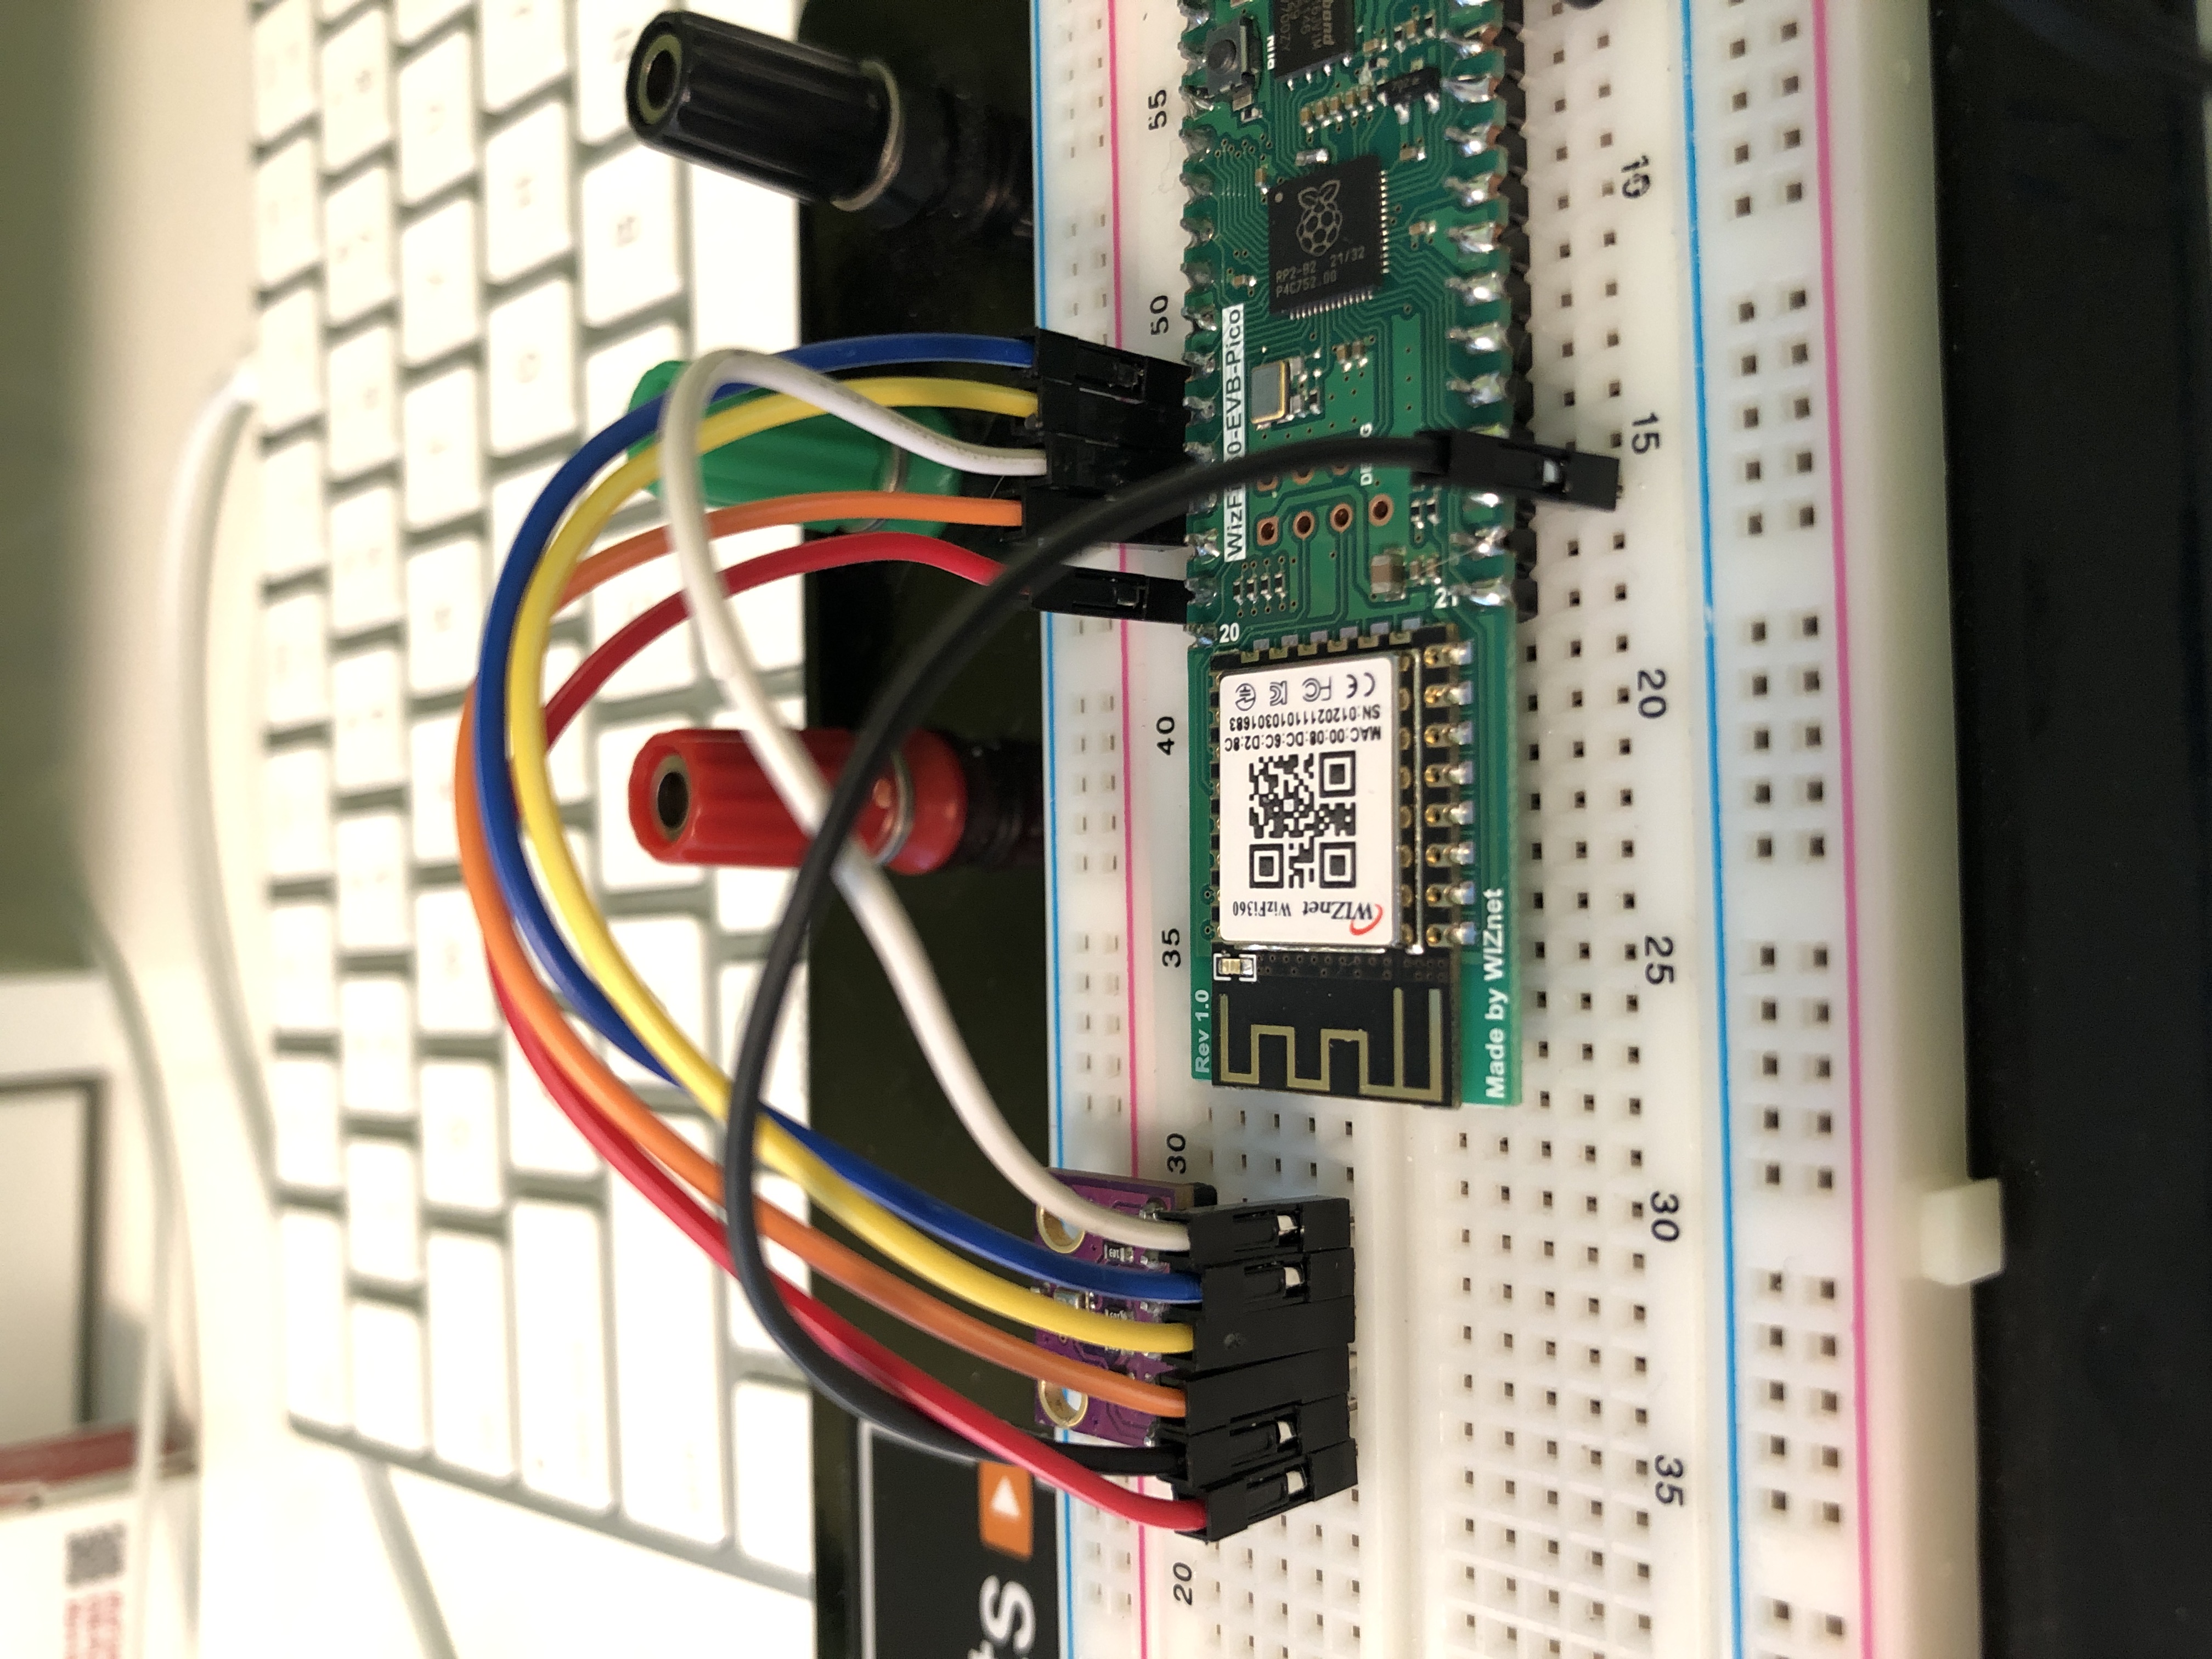
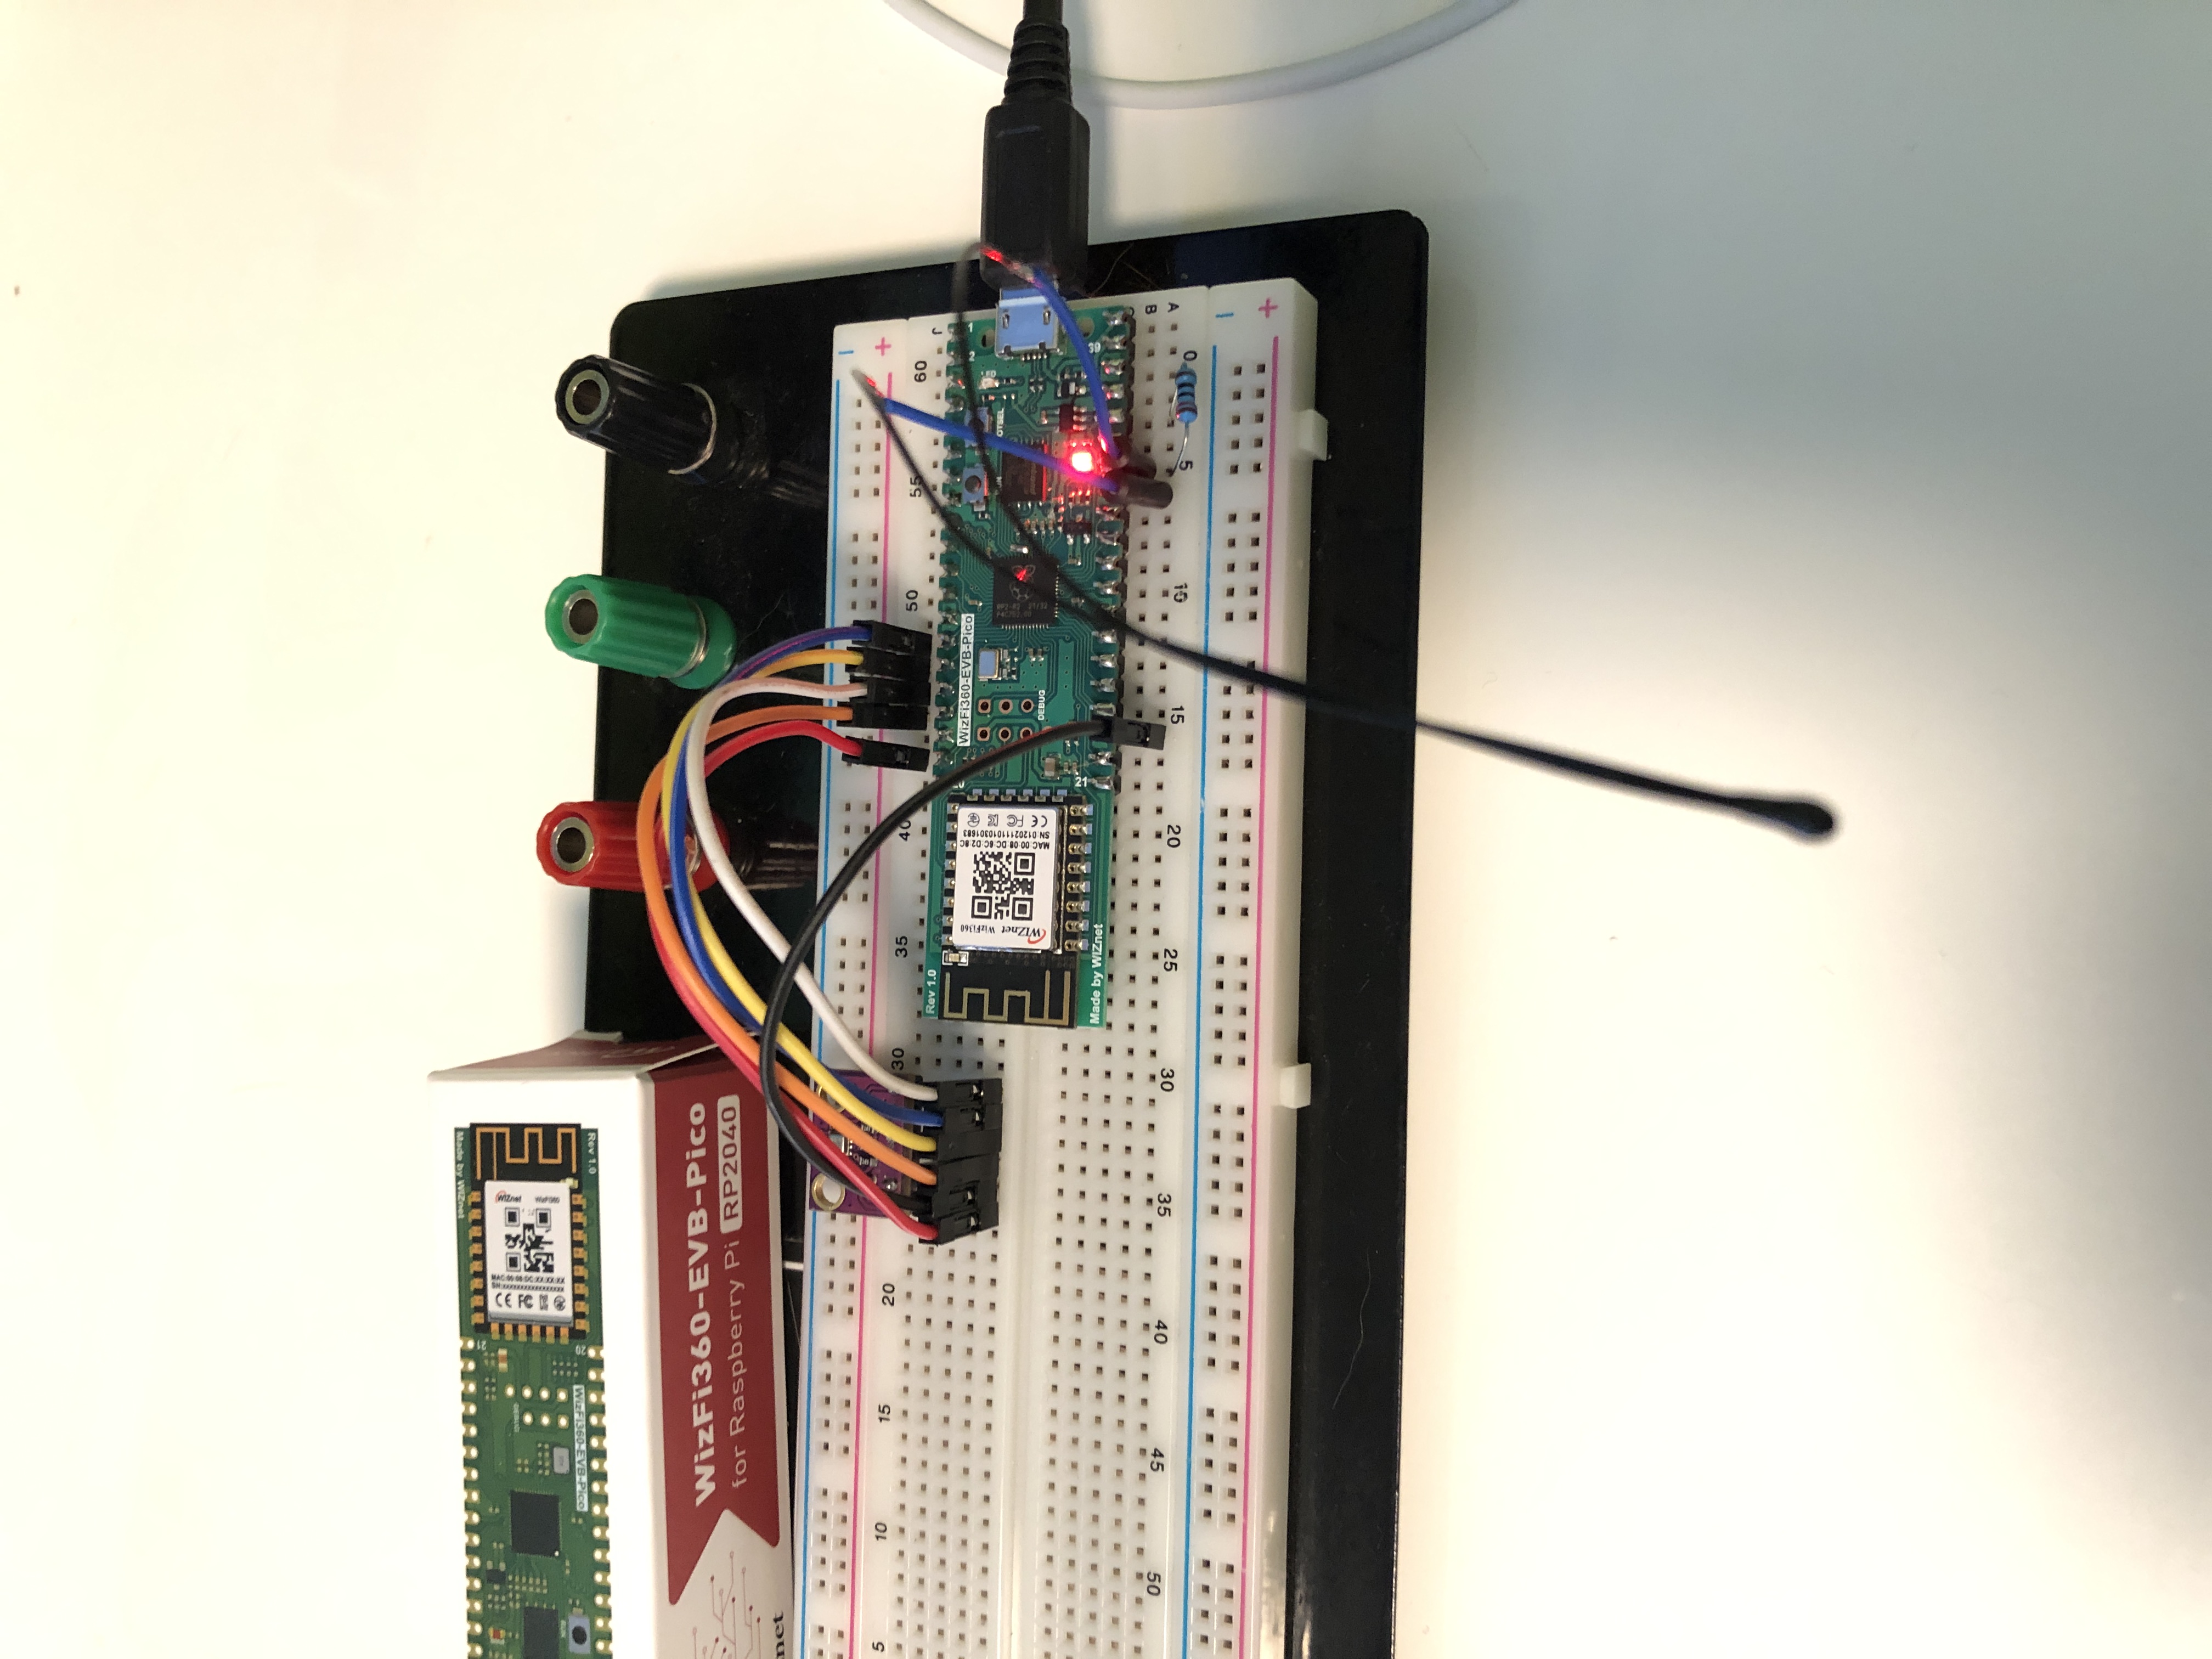
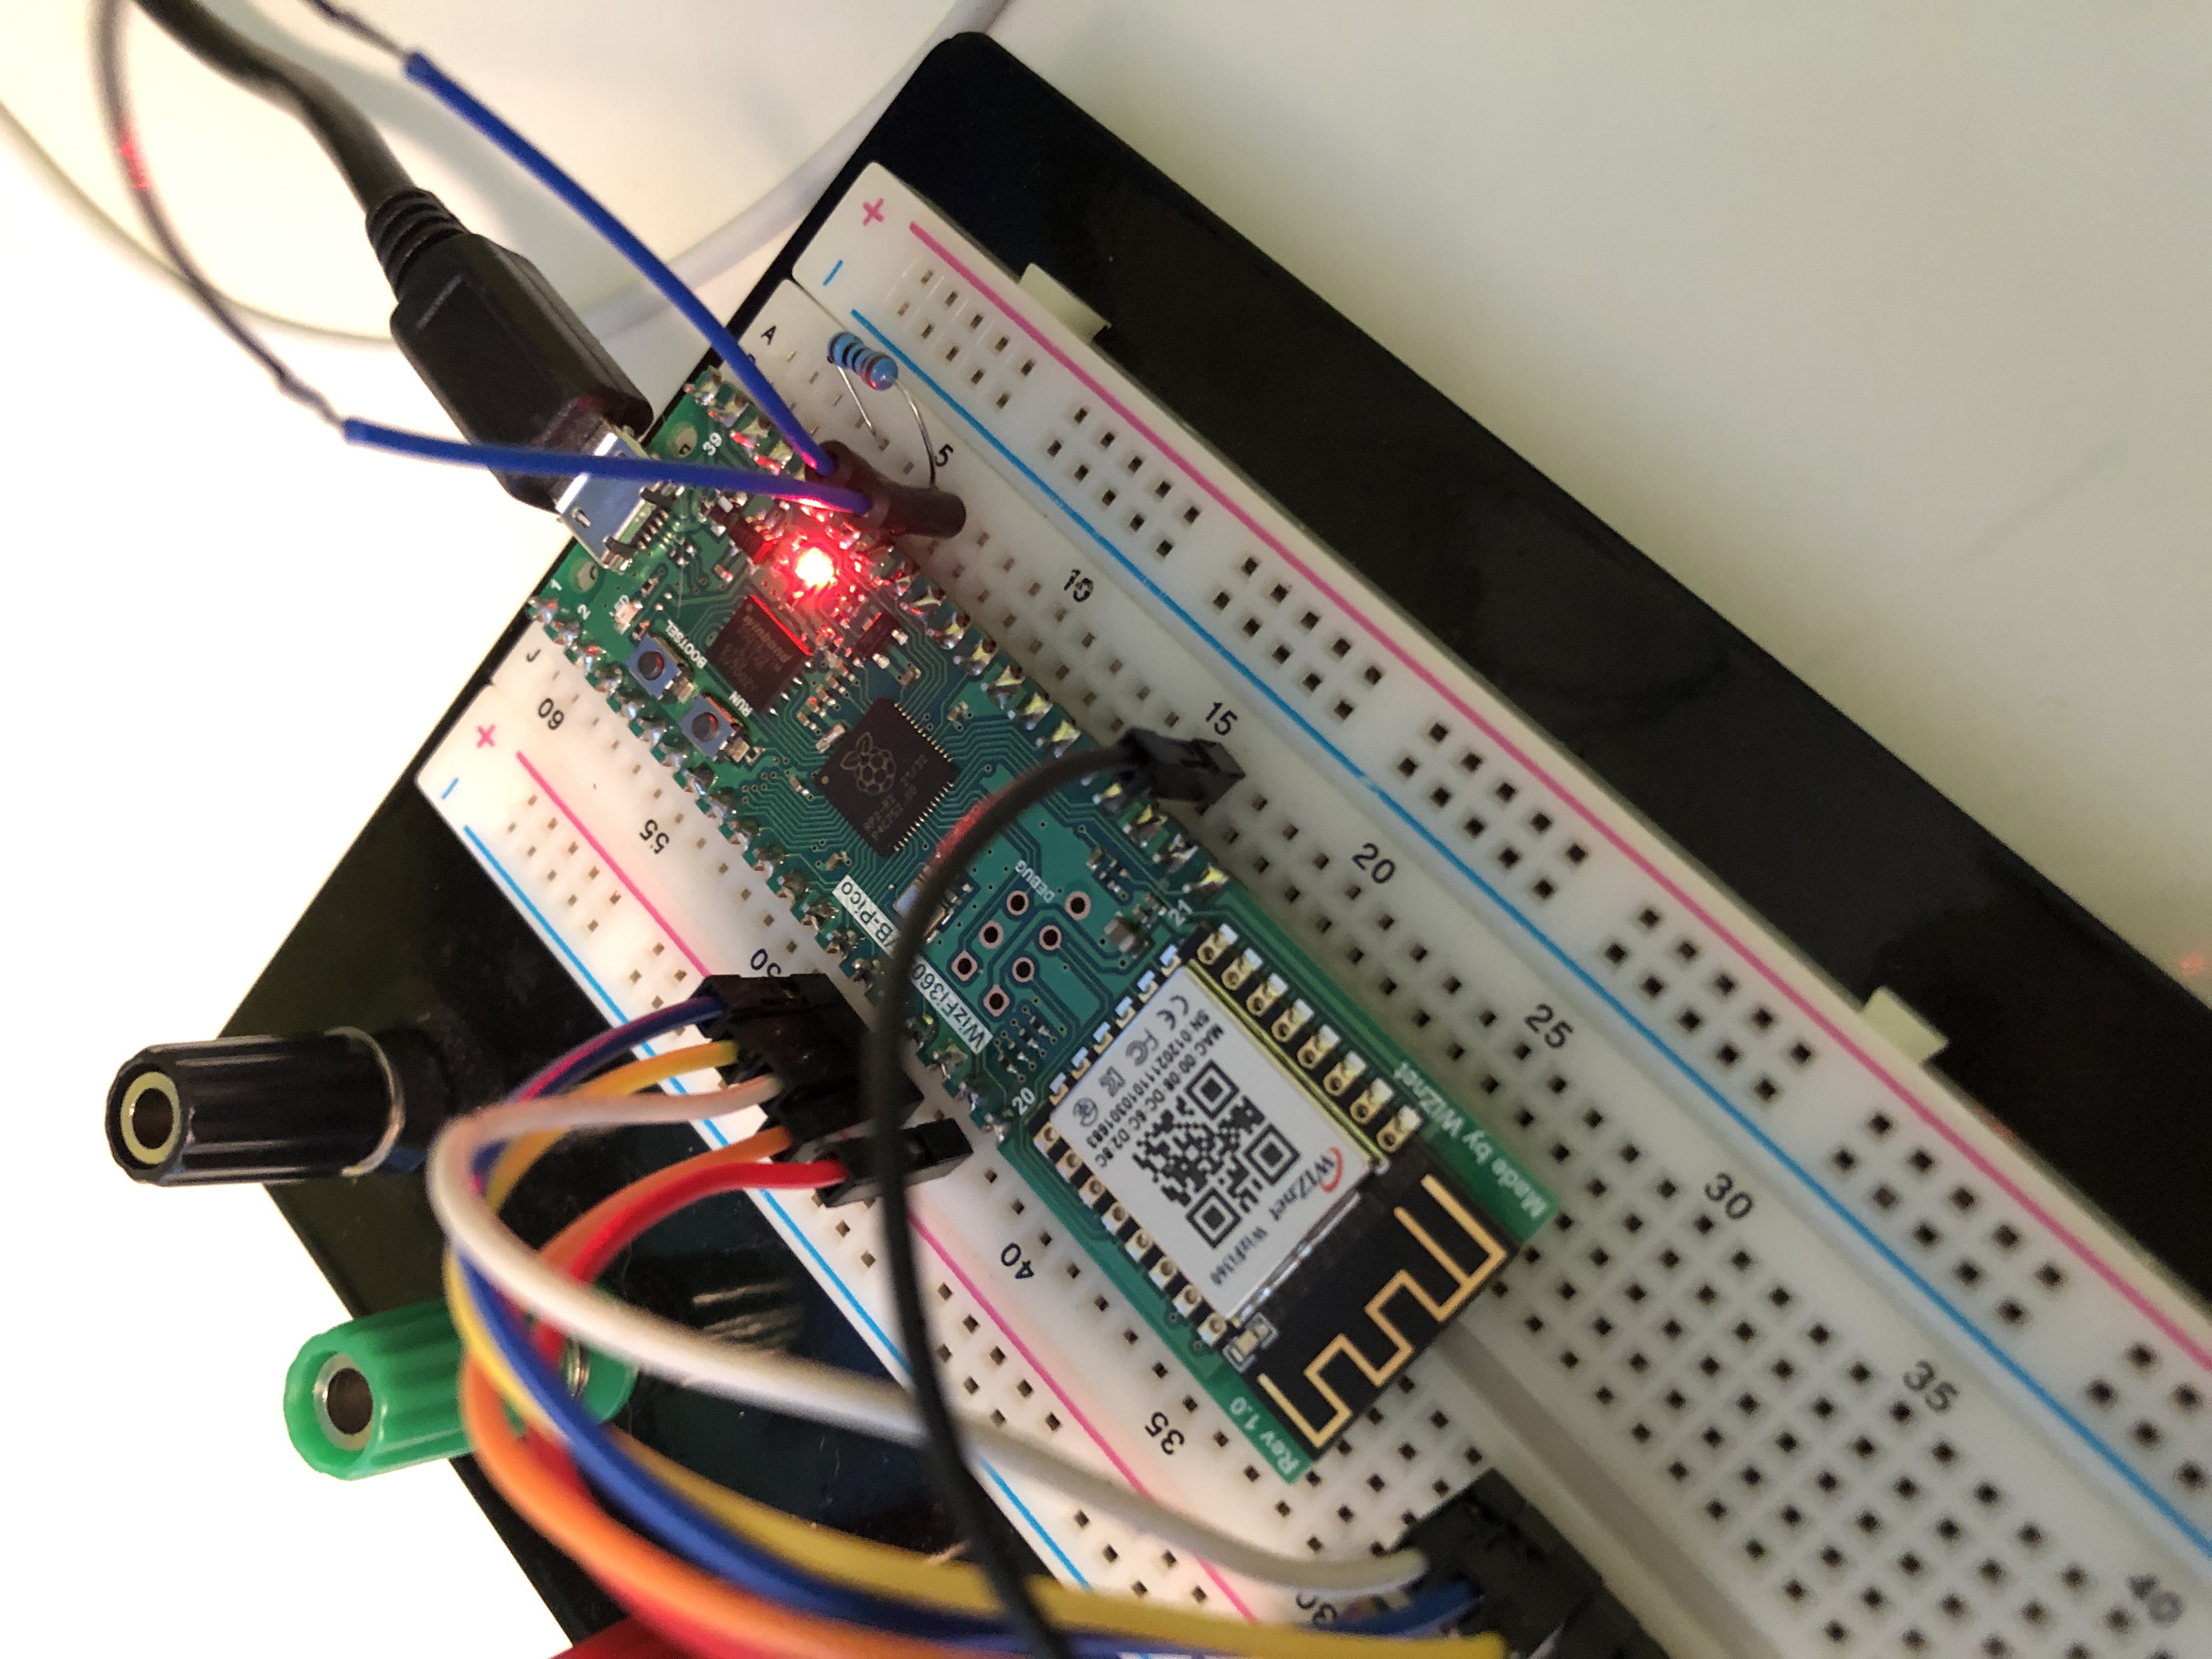
This is what the wiring looks like for the BME280 connections to the WizFi360-EVB-Pico:
The Raspberry Pi Server
The Raspberry Pi will be used as the server to receive and store the temperature data, and also to provide an easy way to display the temperatures to the user.
In a nutshell, the Raspberry Pi computer will do these things:
- Enables communication with the WizNet IoT temperature sensor, using simple http commands
- Receives incoming temperature data from the IoT sensor, using Node-Red
- Interprets the incoming json data
- Displays the weather data to the user
Please note that I can not guarantee anything about the external links (URLs) I’m providing, other than that I used them for guidance. They are external third-party sites that are likely to change in the future, or they might become outdated in the future. I recommend using a search engine to find up to date information that is best suited for you.
We will install the software in a step-by-step order that allows us to do some simple tests with every step of the way, before moving on to the next steps. It’s much more difficult to track down problems when there are too many pieces in play at once.
Set up the Raspberry Pi Computer
The first step is to set up the Raspberry Pi.
The Raspberry Pi computer will be the server that really does most of the work of receiving the data, storing it, and displaying it.
Since this has been documented many times before, I will simply defer this step to the experts: https://www.raspberrypi.com/documentation/computers/getting-started.html
Many other tutorials are available online too - I recommend a search to see what makes the most sense for you.
Make sure your Raspberry Pi is connected to your local network by the time you are done setting it up. The WizFi IoT sensor will be connecting to your local network and will need to be able to find the Raspberry Pi in the same network.
Note: Do not connect the WizFi or the Raspberry Pi to your guest network. Guest networks usually employ “guest isolation” where, for security reasons, devices cannot see any other devices on the same network - they can only access the Internet. For some reason this trips me up far more often than it should!
At this point, test the Raspberry Pi computer by using it like the little computer it is: open the browser, check that you can view things on the Internet.
Now open up a Terminal window, as we will need this to install the rest of the software.
Here is a tutorial on using the Terminal: https://projects.raspberrypi.org/en/projects/raspberry-pi-using/8
Please note that all of the things we are doing for this project can also be done while using the Raspberry Pi computer as a “headless” computer - ie, plugged into the network and power, but without a keyboard, mouse, or monitor attached - we then use a different computer to “ssh” to it and use it via the command line that way. If you are an advanced user you may want to just do it all this way. If the Raspberry Pi is only to be used as a server, this can be a much more efficient way to do it, as no memory or CPU is wasted on having a graphical user interface.
Now that we know the Raspberry Pi is working properly, we can install the next bit of software.
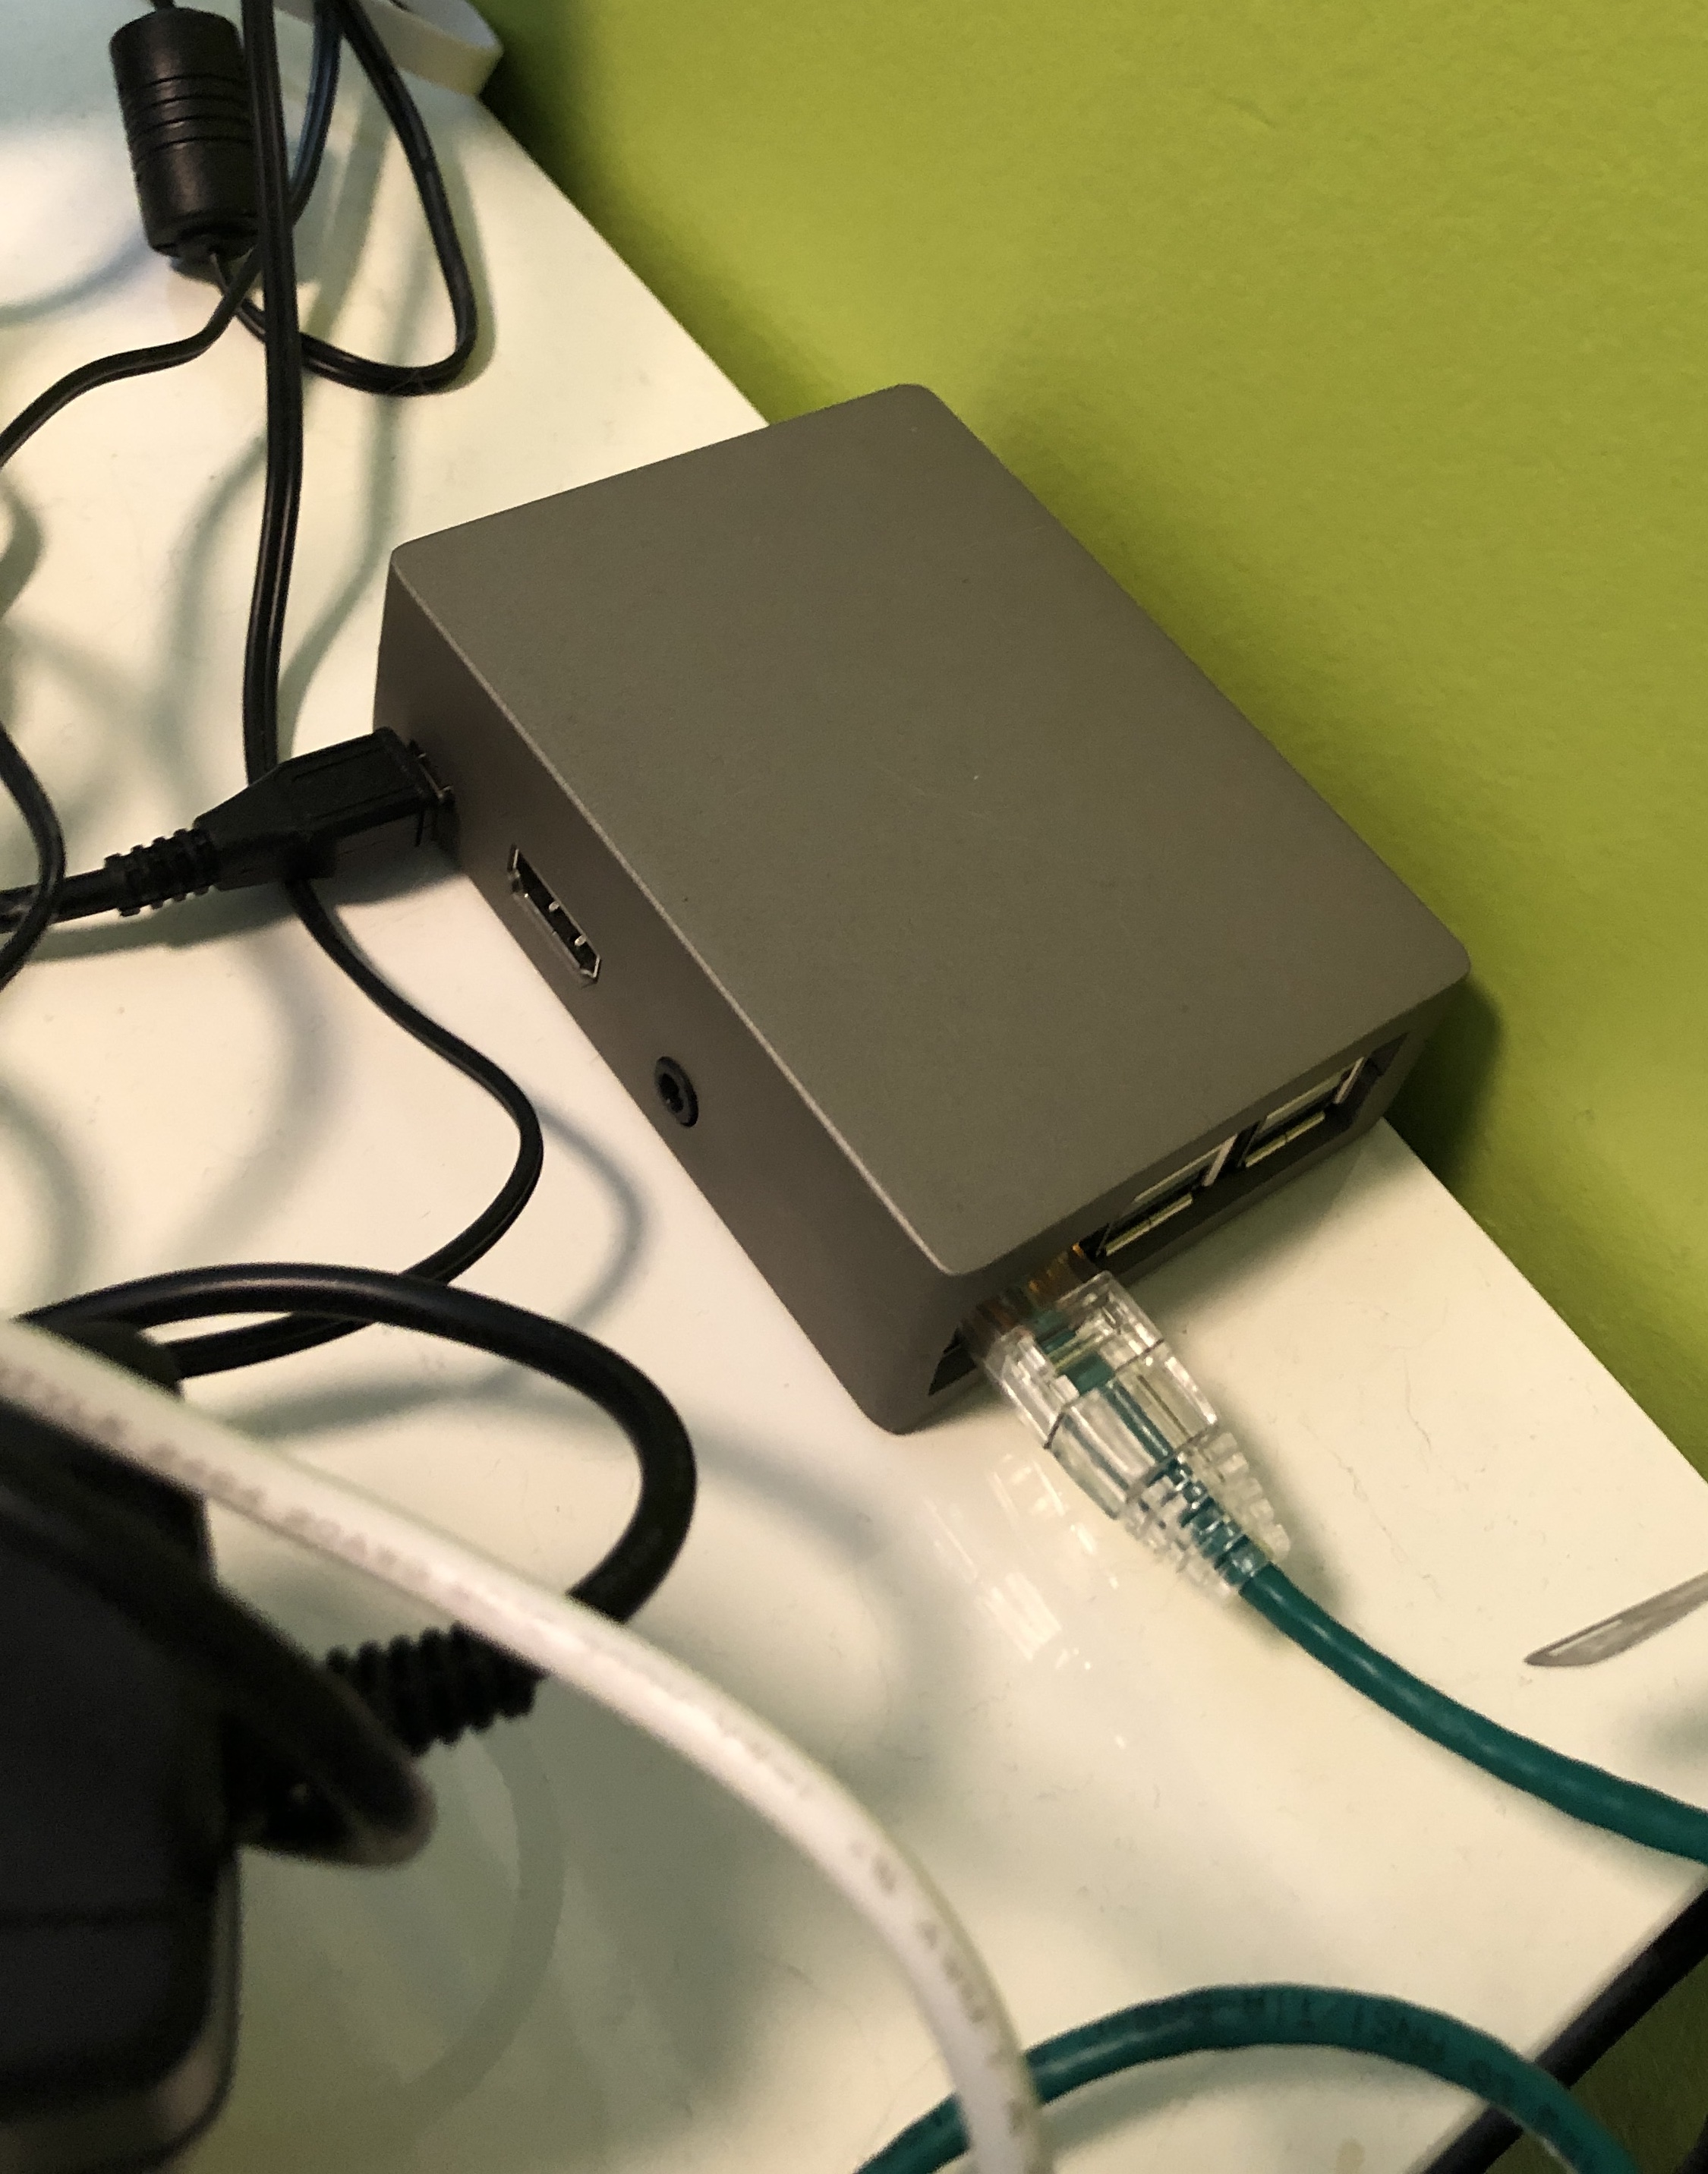
My Raspberry Pi has been happily working away on the side of my desk for quite some time now, in a protective heatsink case that keeps it cooler while also looking much nicer. It looks like it doesn't get much love there surrounded by all the other wires and bits, but believe me, it's very happy there. It tells me so ;)
Install Node-Red
The next step is to install Node-Red on the Raspberry Pi.
Node-Red allows us to use an easy, visual, flow-chart style programming interface to take care of receiving and processing the temperature data.
Again, this is best left for the experts to explain. A quick search found me this tutorial which also explains more about what Node-Red is: https://randomnerdtutorials.com/getting-started-node-red-raspberry-pi/
For our use, Node-Red will be programmed to receive our sensor data via HTTP, and show the results in a graphical UI. Thankfully, Node-Red takes care of the HTTP endpoint and the UI, so we don’t have to set up any other software.
The tutorial also shows how to test Node-Red - mainly just start the program and see the visual interface.
To see the Node-Red dashboard in your browser, use the following URL, changing "piserver" for your own IP address or Raspberry Pi name, of course: raspberrypiserver.local:1880
Test Node-Red with an HTTP command
At this point we will add a quick little test that allows us to receive data from a browser and display the debug data - this will verify that everything is working well so far. I found it easiest to use http for communicating the sensor data, as MQTT would require installation of extra software, and for this project it's not really needed. MQTT also adds more complexity in the Arduino sketch that we can now just avoid.
For testing, we will use the URL format that we eventually will be sending from the WizFi360 sensor:
http://piserver.local:1880/wiznetsensor?json={"sensor_id":"mqtt1","tempc":21.28,"humidity":60.46,"pressure":1014.79,"probeTempc":21.87}
Note: Be careful with the quotation “ marks - text editors often change them to special start/end quotation marks that won’t work in the http call.
The sensorID was added to help us distinguish between multiple sensors. It’s not really necessary for this project, as I only have the one sensor, but if I ever decide to add more sensors I won’t have to change anything for the existing sensor.
In Node-Red we simply filter by that sensorID so that existing data does not get muddled as we start adding more sensors.
When adding a new sensor we can then simply duplicate what we have done for sensor1, change the sensorID to 2, and instantly have the ability to display data for the new sensor without much effort at all.
Now, even before involving the WIZnet sensor board, we can actually complete the Node-Red flow and UI, by simply using the test URL. Adding the debug node allows us to view the incoming data in the Node-Red debug window. How easy was that!?
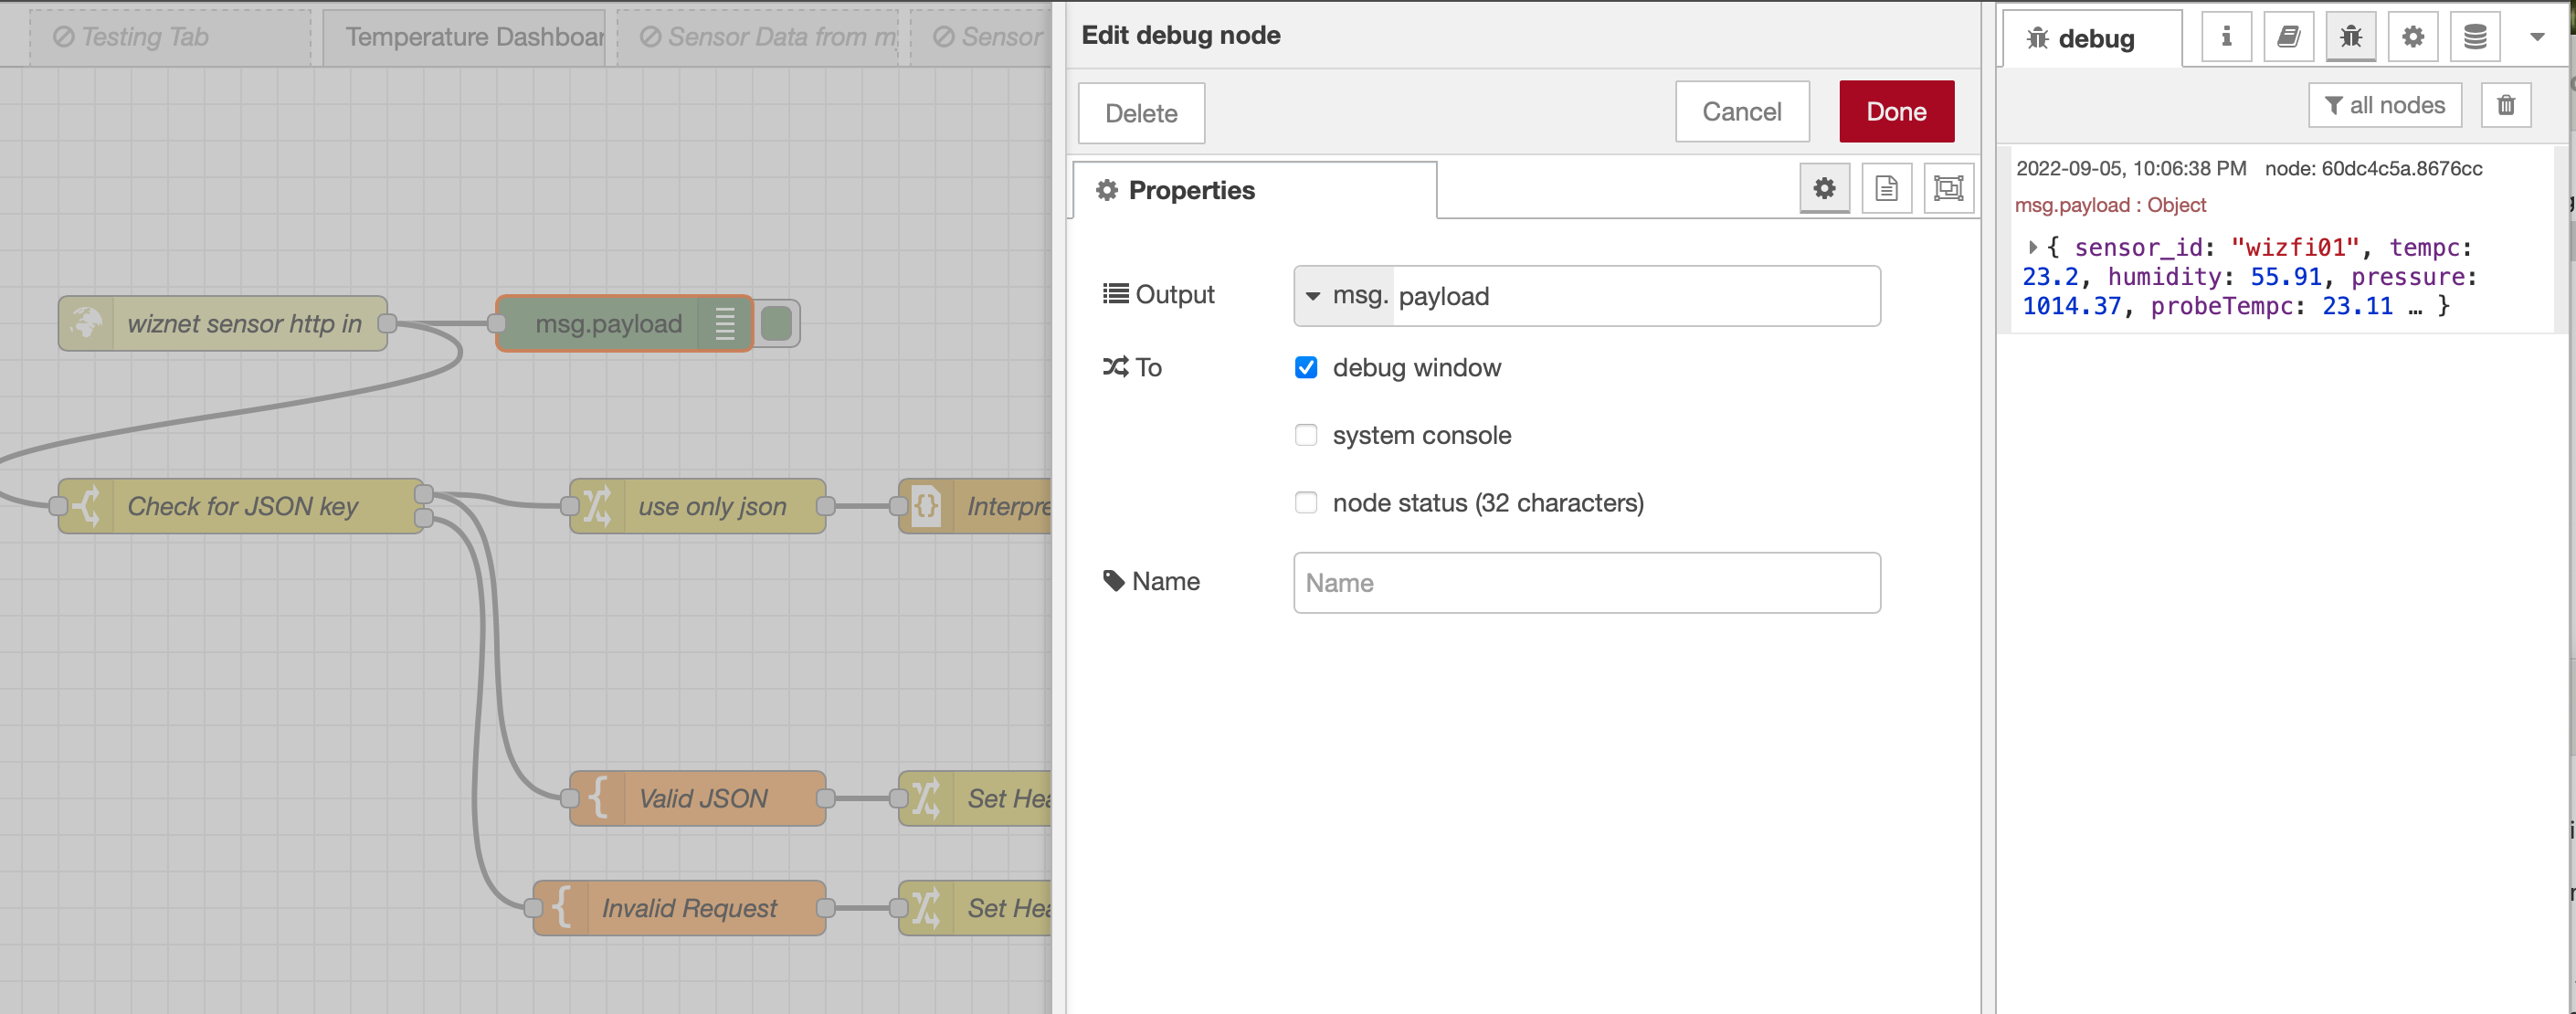
In a nutshell, after receiving the incoming data we need to parse the json and filter for our sensor ID. Then we can pass the results to the various gauges we’ve set up.
I’ve included my exported Node-Red flow as part of this project. After importing, it should look something like my Node-Red flow:
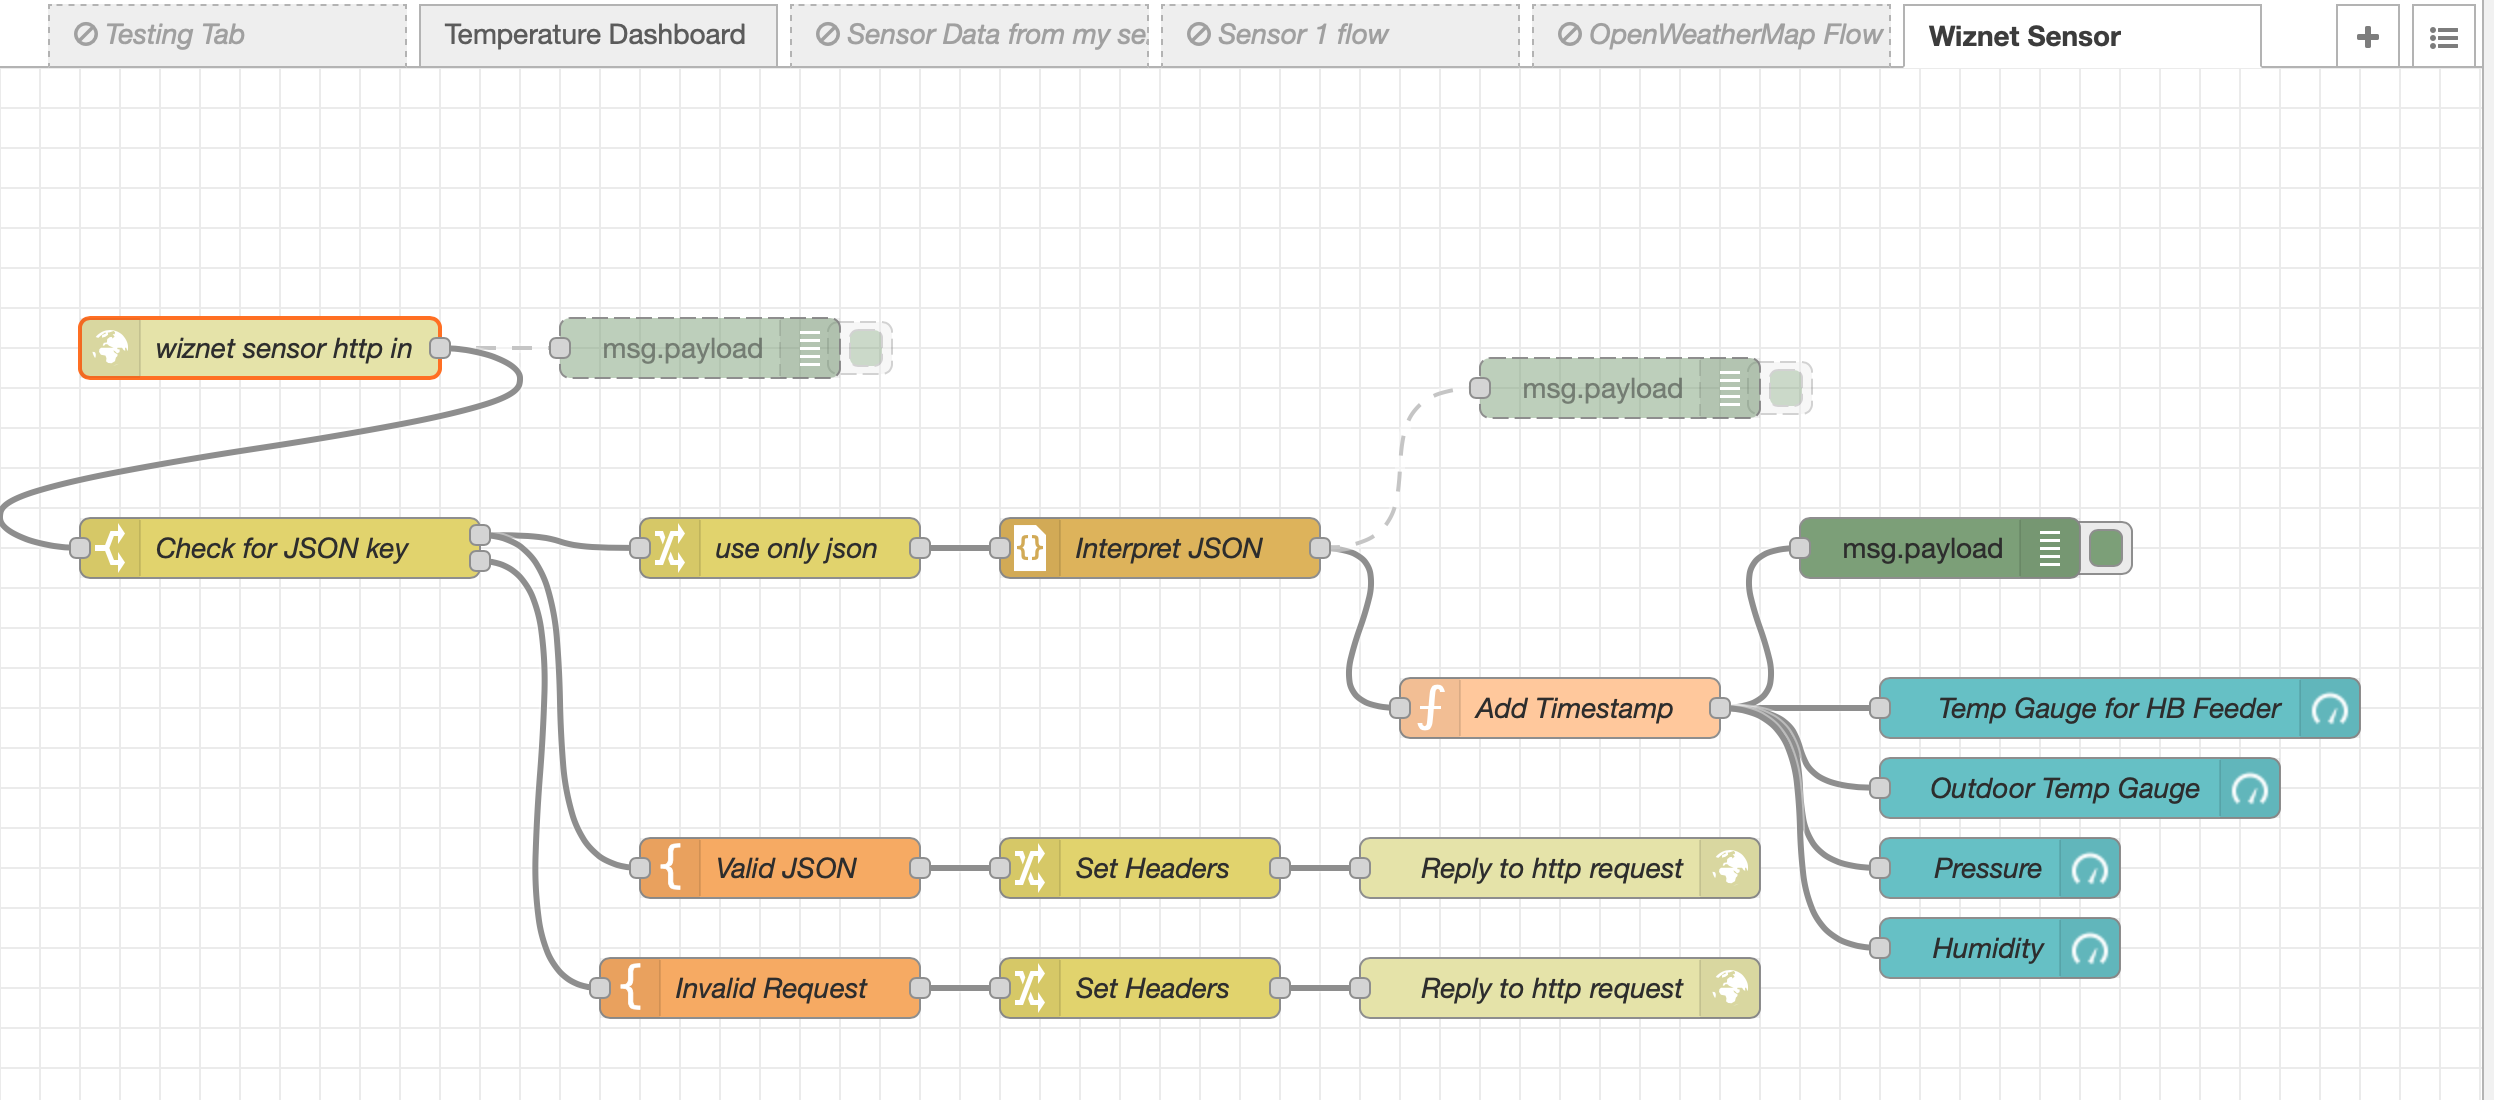
Please ignore the other tabs in this picture. They don't apply to this project. I've been using them for testing and for other projects.
Please Note that I chose to handle all of the (simple) UI directly with Node-Red. This saves us from having to install and set up additional software like Grafana.
To see the UI created by Node-Red, use this URL (again, changing the name of the server to whatever you are using) - raspberrypiserver.local:1880/ui/
Now that we can receive data via HTTP and have it be displayed in a nice little UI, we can send the data from the WizFi sensor via HTTP in the same way!
As we’ve already set up and tested the Raspberry Pi server and Node-Red, we can be confident that it all should work in the same way from the WIZnet sensor board, as long as we form our URL properly. If you run into trouble, the debug node should help in figuring out what went wrong - often it's just little details that cause big problems (like that quotation mark issue I mentioned earlier!!)
When starting this kind of project, it’s best to divide and test the main parts of the sketch separately first. In my case I started with a sketch that simply reads weather data from the BME280 sensor and prints it to the Serial console.
Once all of that was working reliably, I tested WiFi connectivity separately using the WizFi360-WebClient example that is included in the Arduino library.
You might have noticed that it took me this far into the project before I actually used the WiFi functionality of the WizFi360-EVB-Pico! The WiFi really is the key feature setting the WizFi360-EVB-Pico ahead of the other regular Raspberry Pi Pico (and related RP2040) type boards, and is critically important to this project, but it makes sense to test the parts separately before introducing the extra complexity of connecting it to WiFi and sending http commands. Start with Blink, and work your way forward!
After seeing success with the provided example sketches, I combined them into the sketch that sends the BME280 sensor data to my Node-Red server.
I again tested to see that now the WizFi360 board was properly sending the weather data to Node-Red and that it was being interpreted and displayed correctly.
So far, so good! I did have a fair number of struggles and hurdles to overcome to get here, so don't be discouraged if everything doesn't just fall together smoothly on your first try.
I then tested my Thermistor separately - first on a simple Arduino Uno, and then adding it to the WizFi360 IoT sketch. I built a separate file of thermistor functions that made it easy to just copy across.
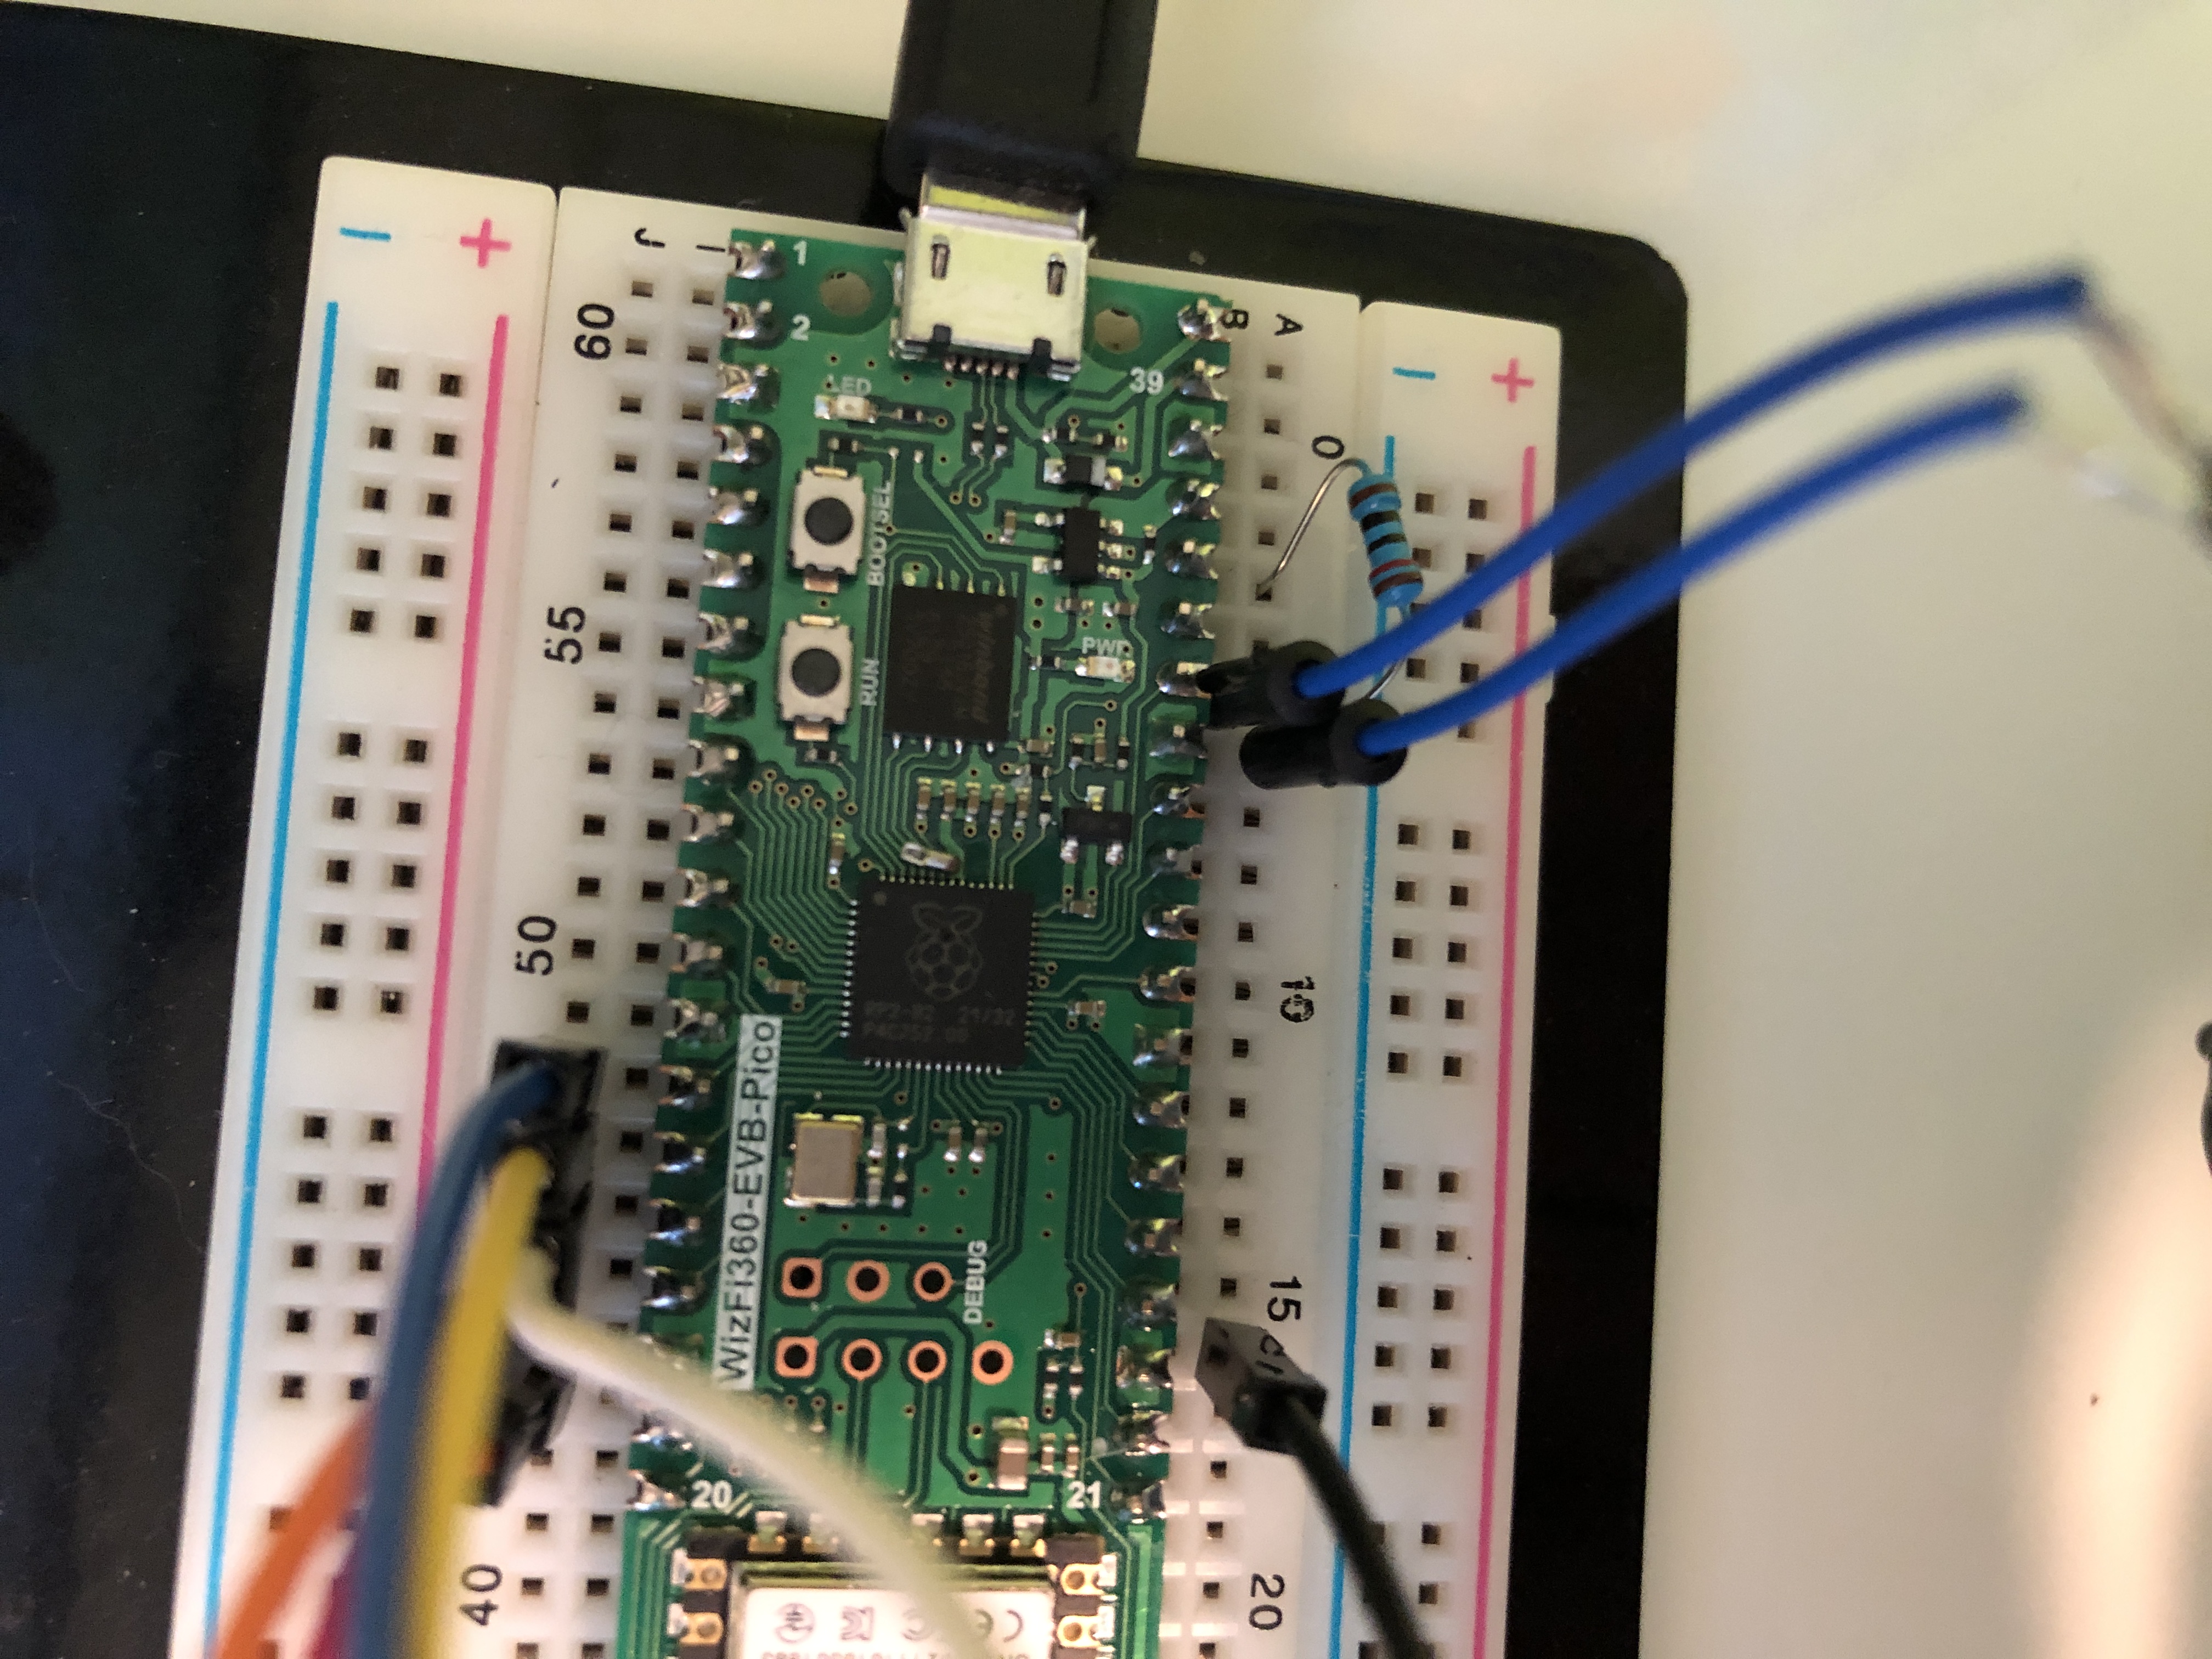
The thermistor is an analog device, and is connected as follows:
- One thermistor lead goes to AGND. I’m not sure if any GND would work, but it appears that the Pi Pico has a special AGND ground for the analog inputs.
- The other thermistor lead goes to GP28
- A 10k resistor is connected between GP28 and 3v3
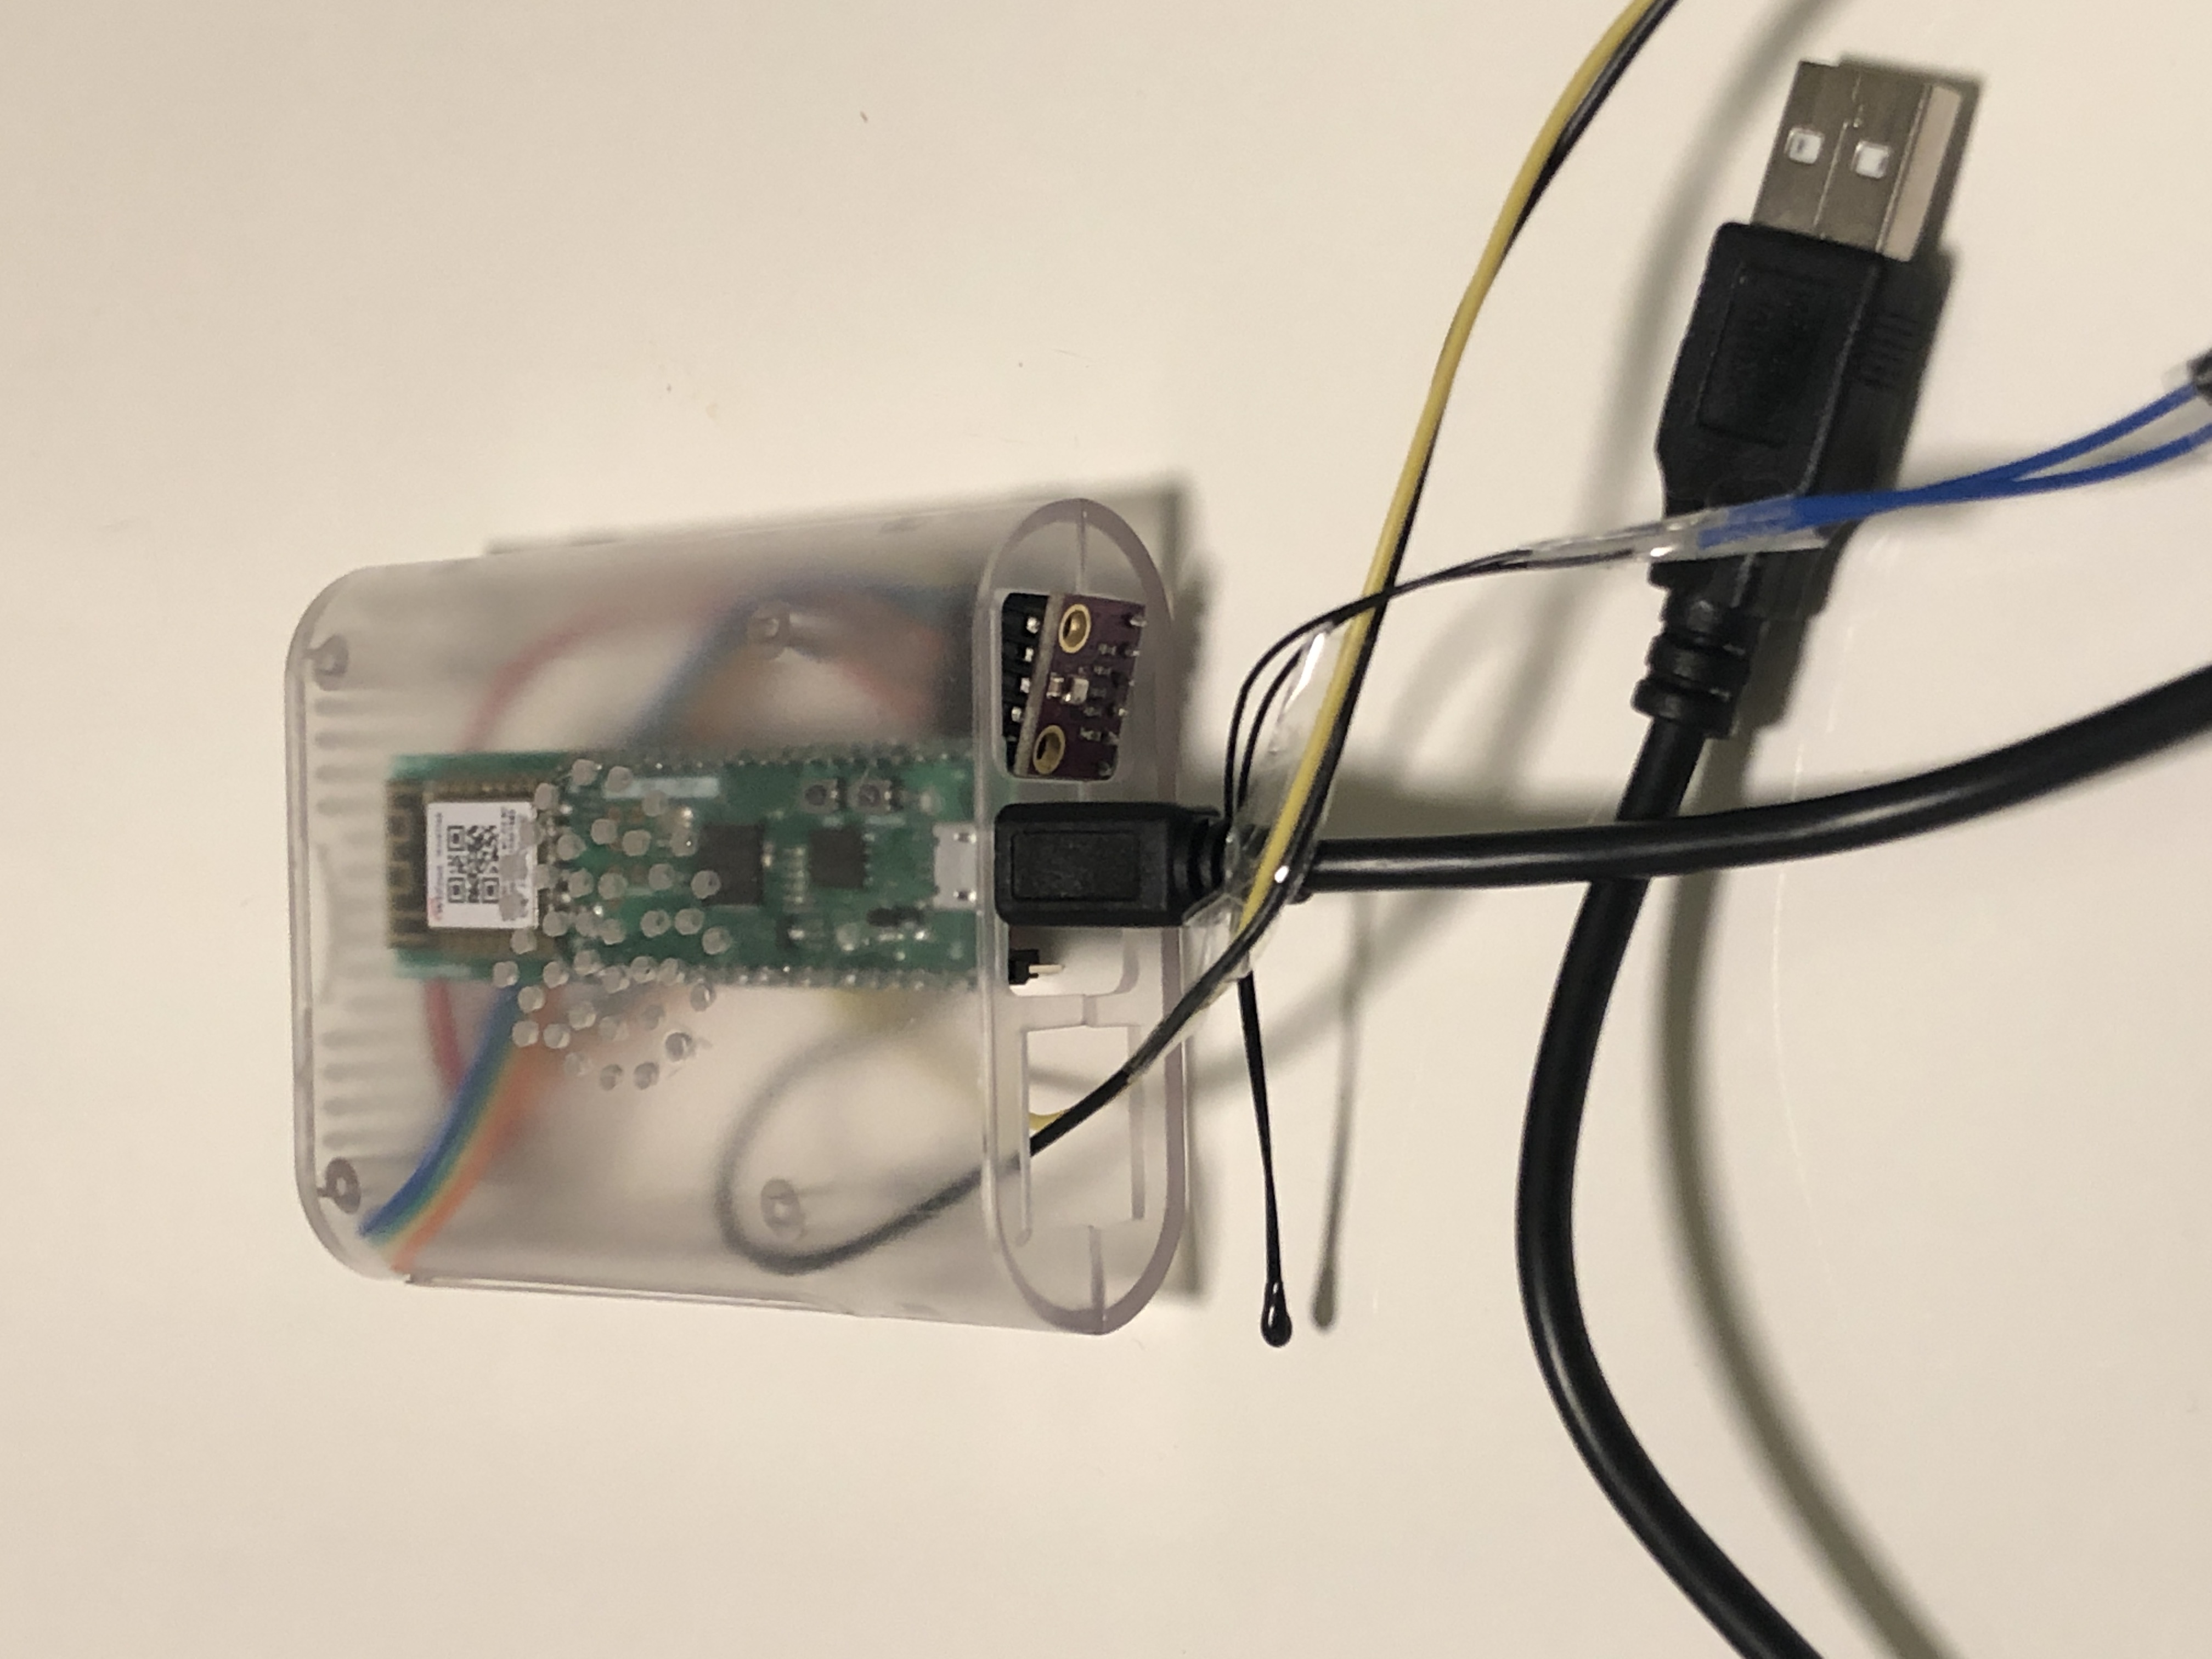
Here is a close up of how the thermistor connects, on the bottom right. The other wires on the left are for the BME sensor.
And that’s how I arrived at my final sketch: “WizFi_IoT_temp_sensor”. The files for that are also included with this project.
The test setup with both sensors connected looked like this:
Running it on my desk like this, I was able to view the results immediately with the Node-Red UI we created earlier:
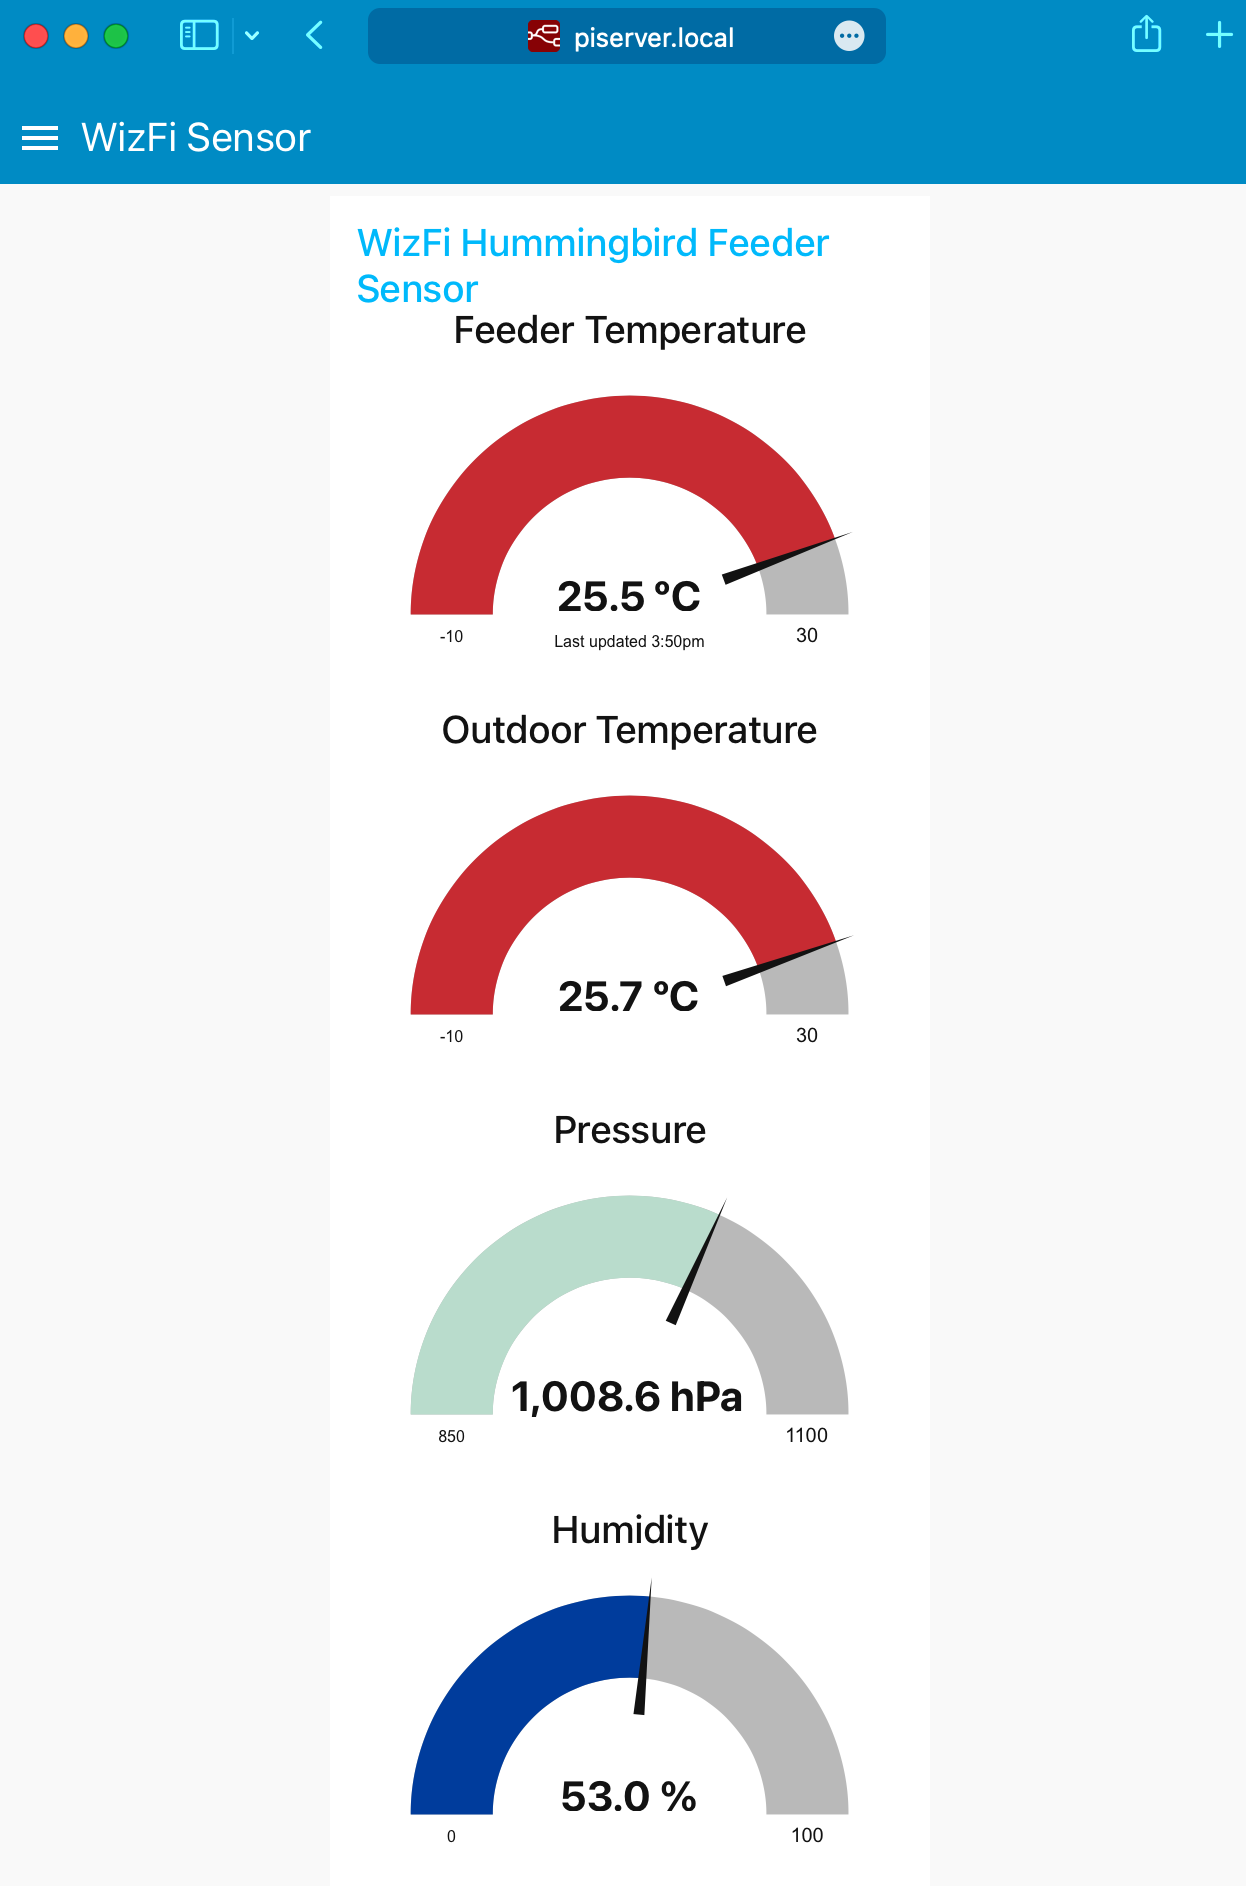
It was quite a warm day when I tested it! It's good to see that the thermistor temperature agrees very closely with the BME280 temperature.
Readying the Sensor for Actual Use at the Hummingbird Feeder.
Once I verified that everything was working according to plan, I pulled the WizFi360-EVB-Pico board off my breadboard, and added the sensor wires directly to the header pins. I then found an old clear-plastic Raspberry Pi case that I was no longer using, and was able to tuck the board neatly into that case. This saved me from having to create and 3D print a specialized case, while still having it all come together into a fairly attractive package - much better than an exposed board with wires going everywhere!
I left the BME280 sensor close to the case to keep it safe from direct weather, but that does require that I take care to mount the case with the BME280 sensor at the bottom - heat produced by the WizFi360-EVB-Pico should rise up, pulling in fresh outside air from the bottom, and hopefully allowing the BME280 to read the actual outdoor weather data. I left enough wire to pull the BME280 sensor out a little further if required.
The thermistor has extra-long leads so that it can be mounted up against the hummingbird feeder bottle. In the winter, the bottle will of course receive some thermal insulation and a USB-powered heater. The thermistor can be tucked inside the insulating sleeve at that time.
In the picture above you can see it just near the bottom-left of the enclosure. It's quite tiny, and should easily fit up against the humming bird feeder bottle.
After mounting the WizFi360-EVB-Pico into the case, I tested everything again - first with the Arduino Serial Console connected, and then by plugging it directly into a USB charger.
Ps, if you run into problems when running it without the Serial Console available, it might be helpful to make use of the user LED (LED_BUILTIN) to flash a few messages to yourself. For example, you could use 5 quick flashes after successfully connecting to WiFi, or rapid never-ending flashes if it fails to setup.
Now that I had verified that the WizFi sensor works independently, I was able to move it outside to start gathering real data!
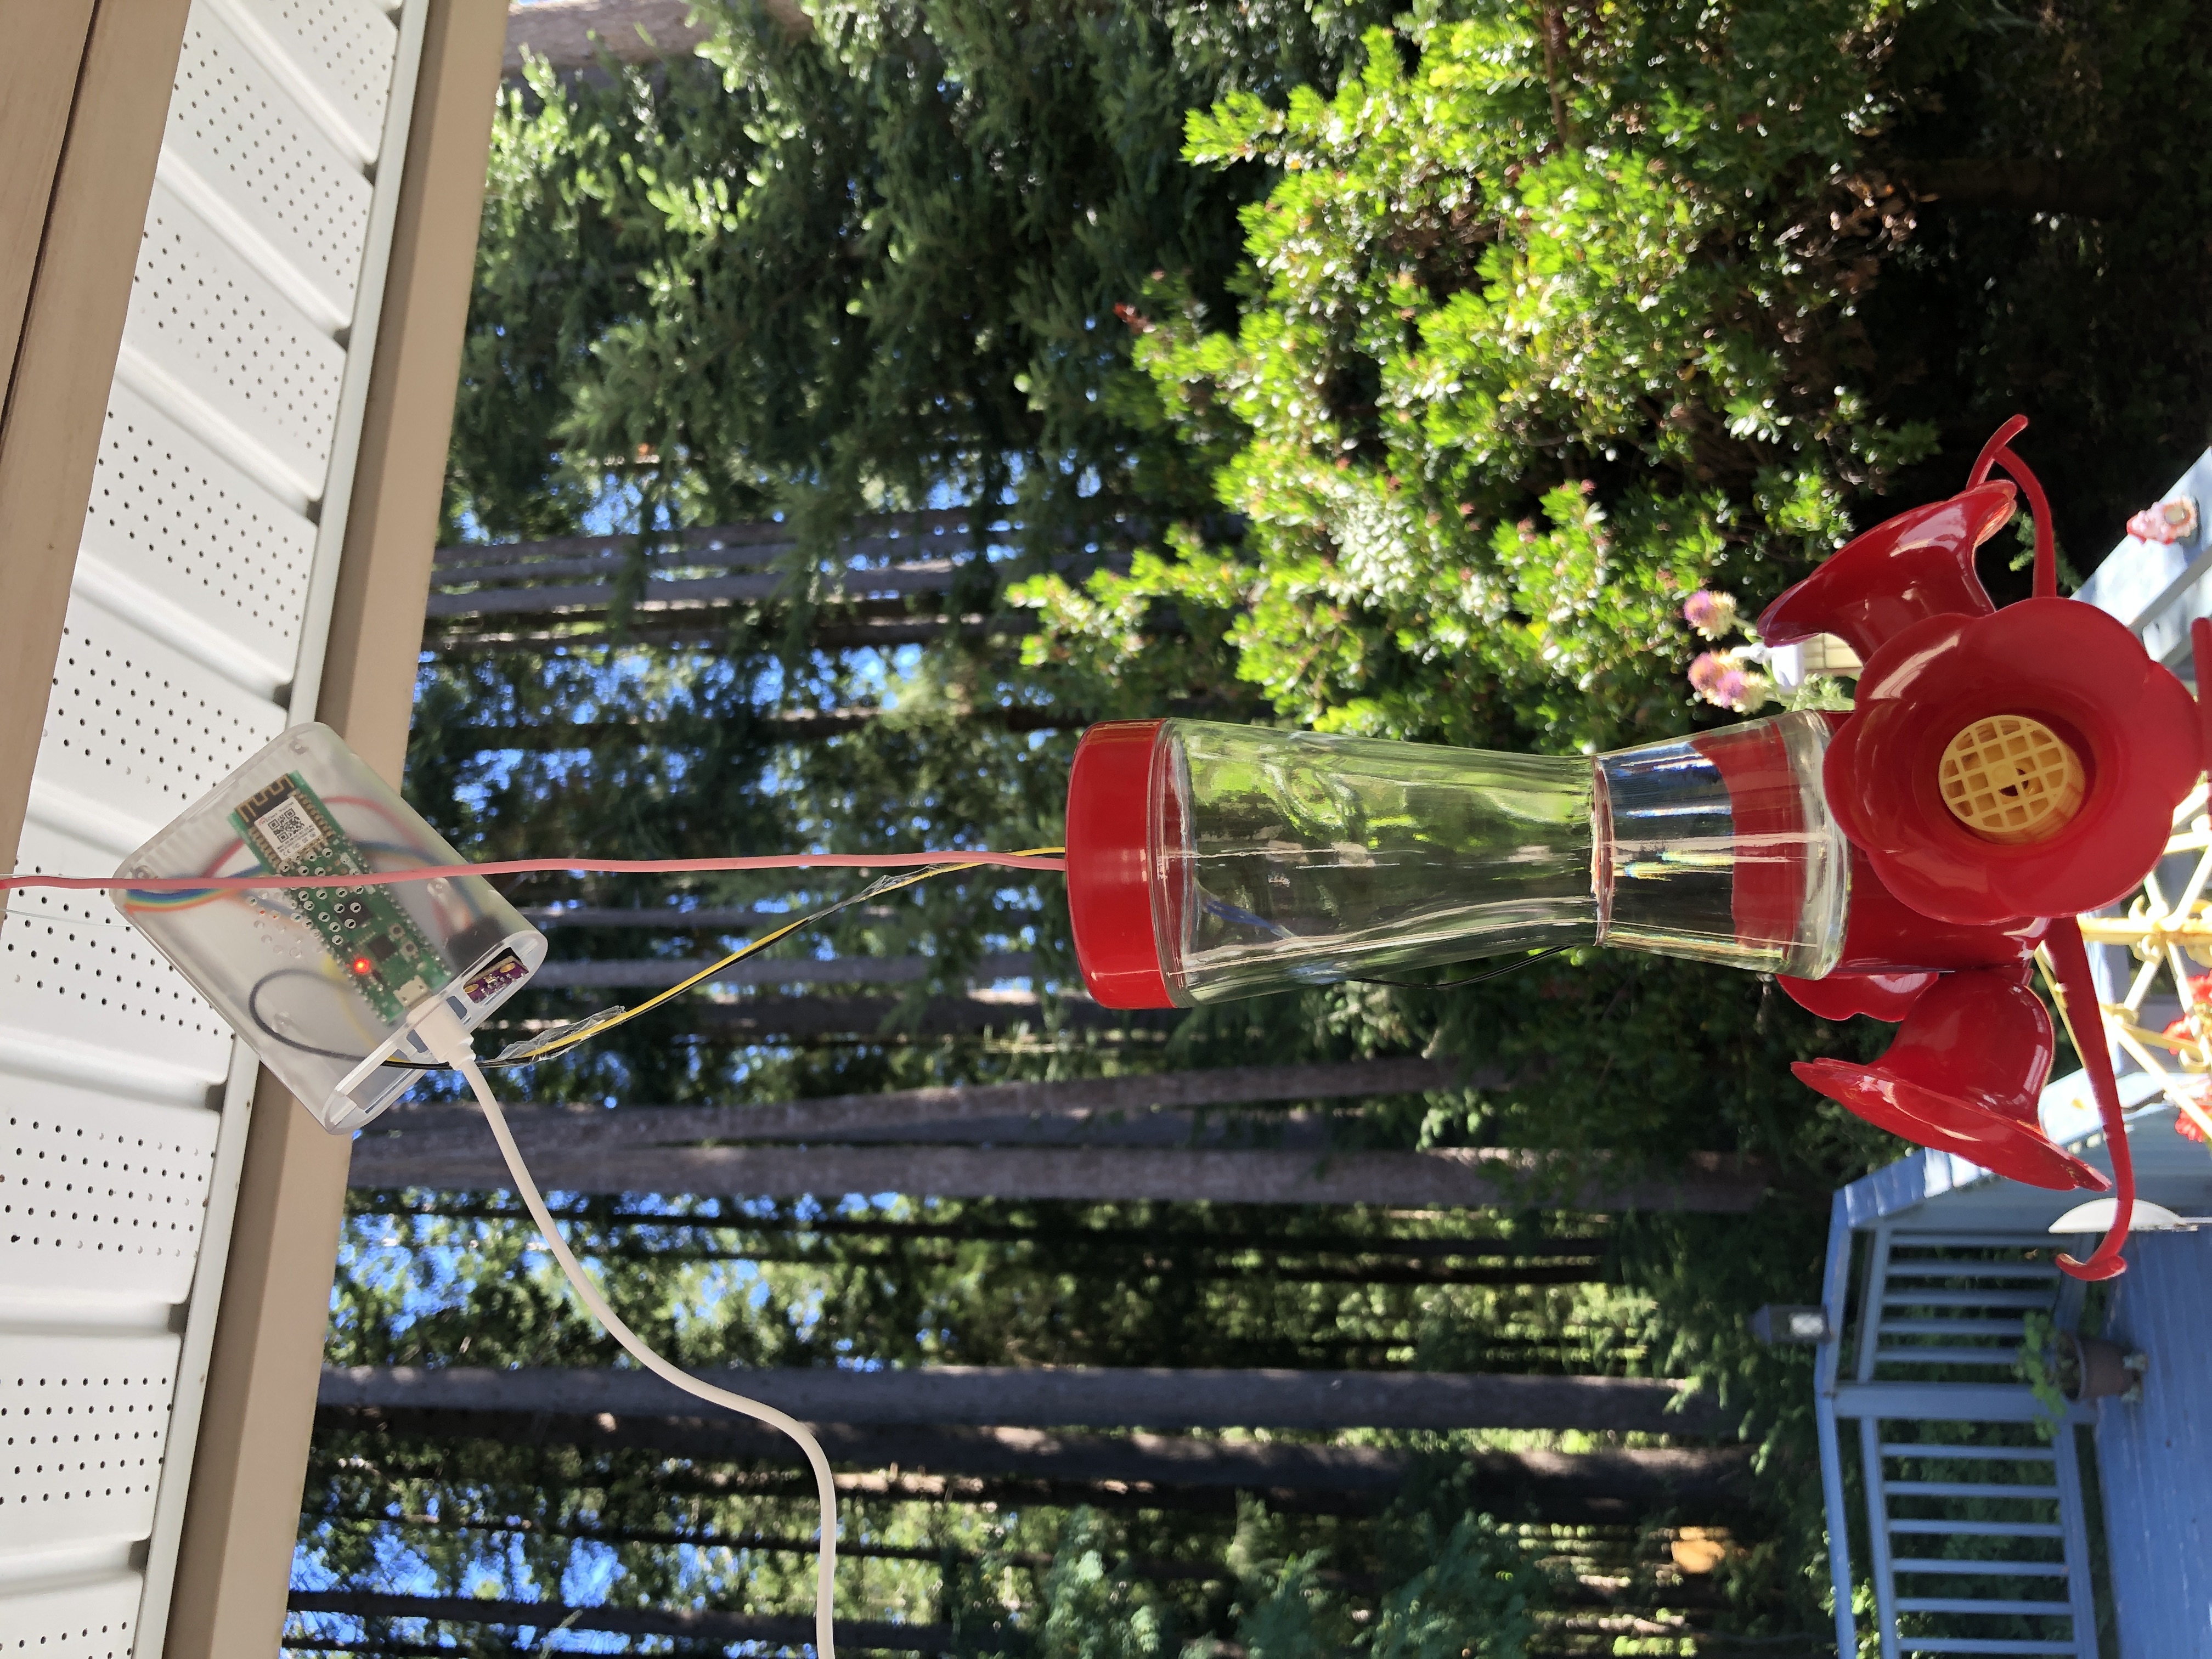
I mounted the thermistor onto the hummingbird feeder nectar bottle by using some foam tape - this holds it in place as well as insulates it against the outside air, to give it a more reliable reading of the nectar temperature. In the winter I would of course add a fully insulated sleeve to cover the whole bottle. At that point I would also have the USB hand warmer up against the glass to help keep it all from freezing. When putting it all together we just have to make sure that the thermistor is away from the heater, so that the temperature readings are not affected by the heater.
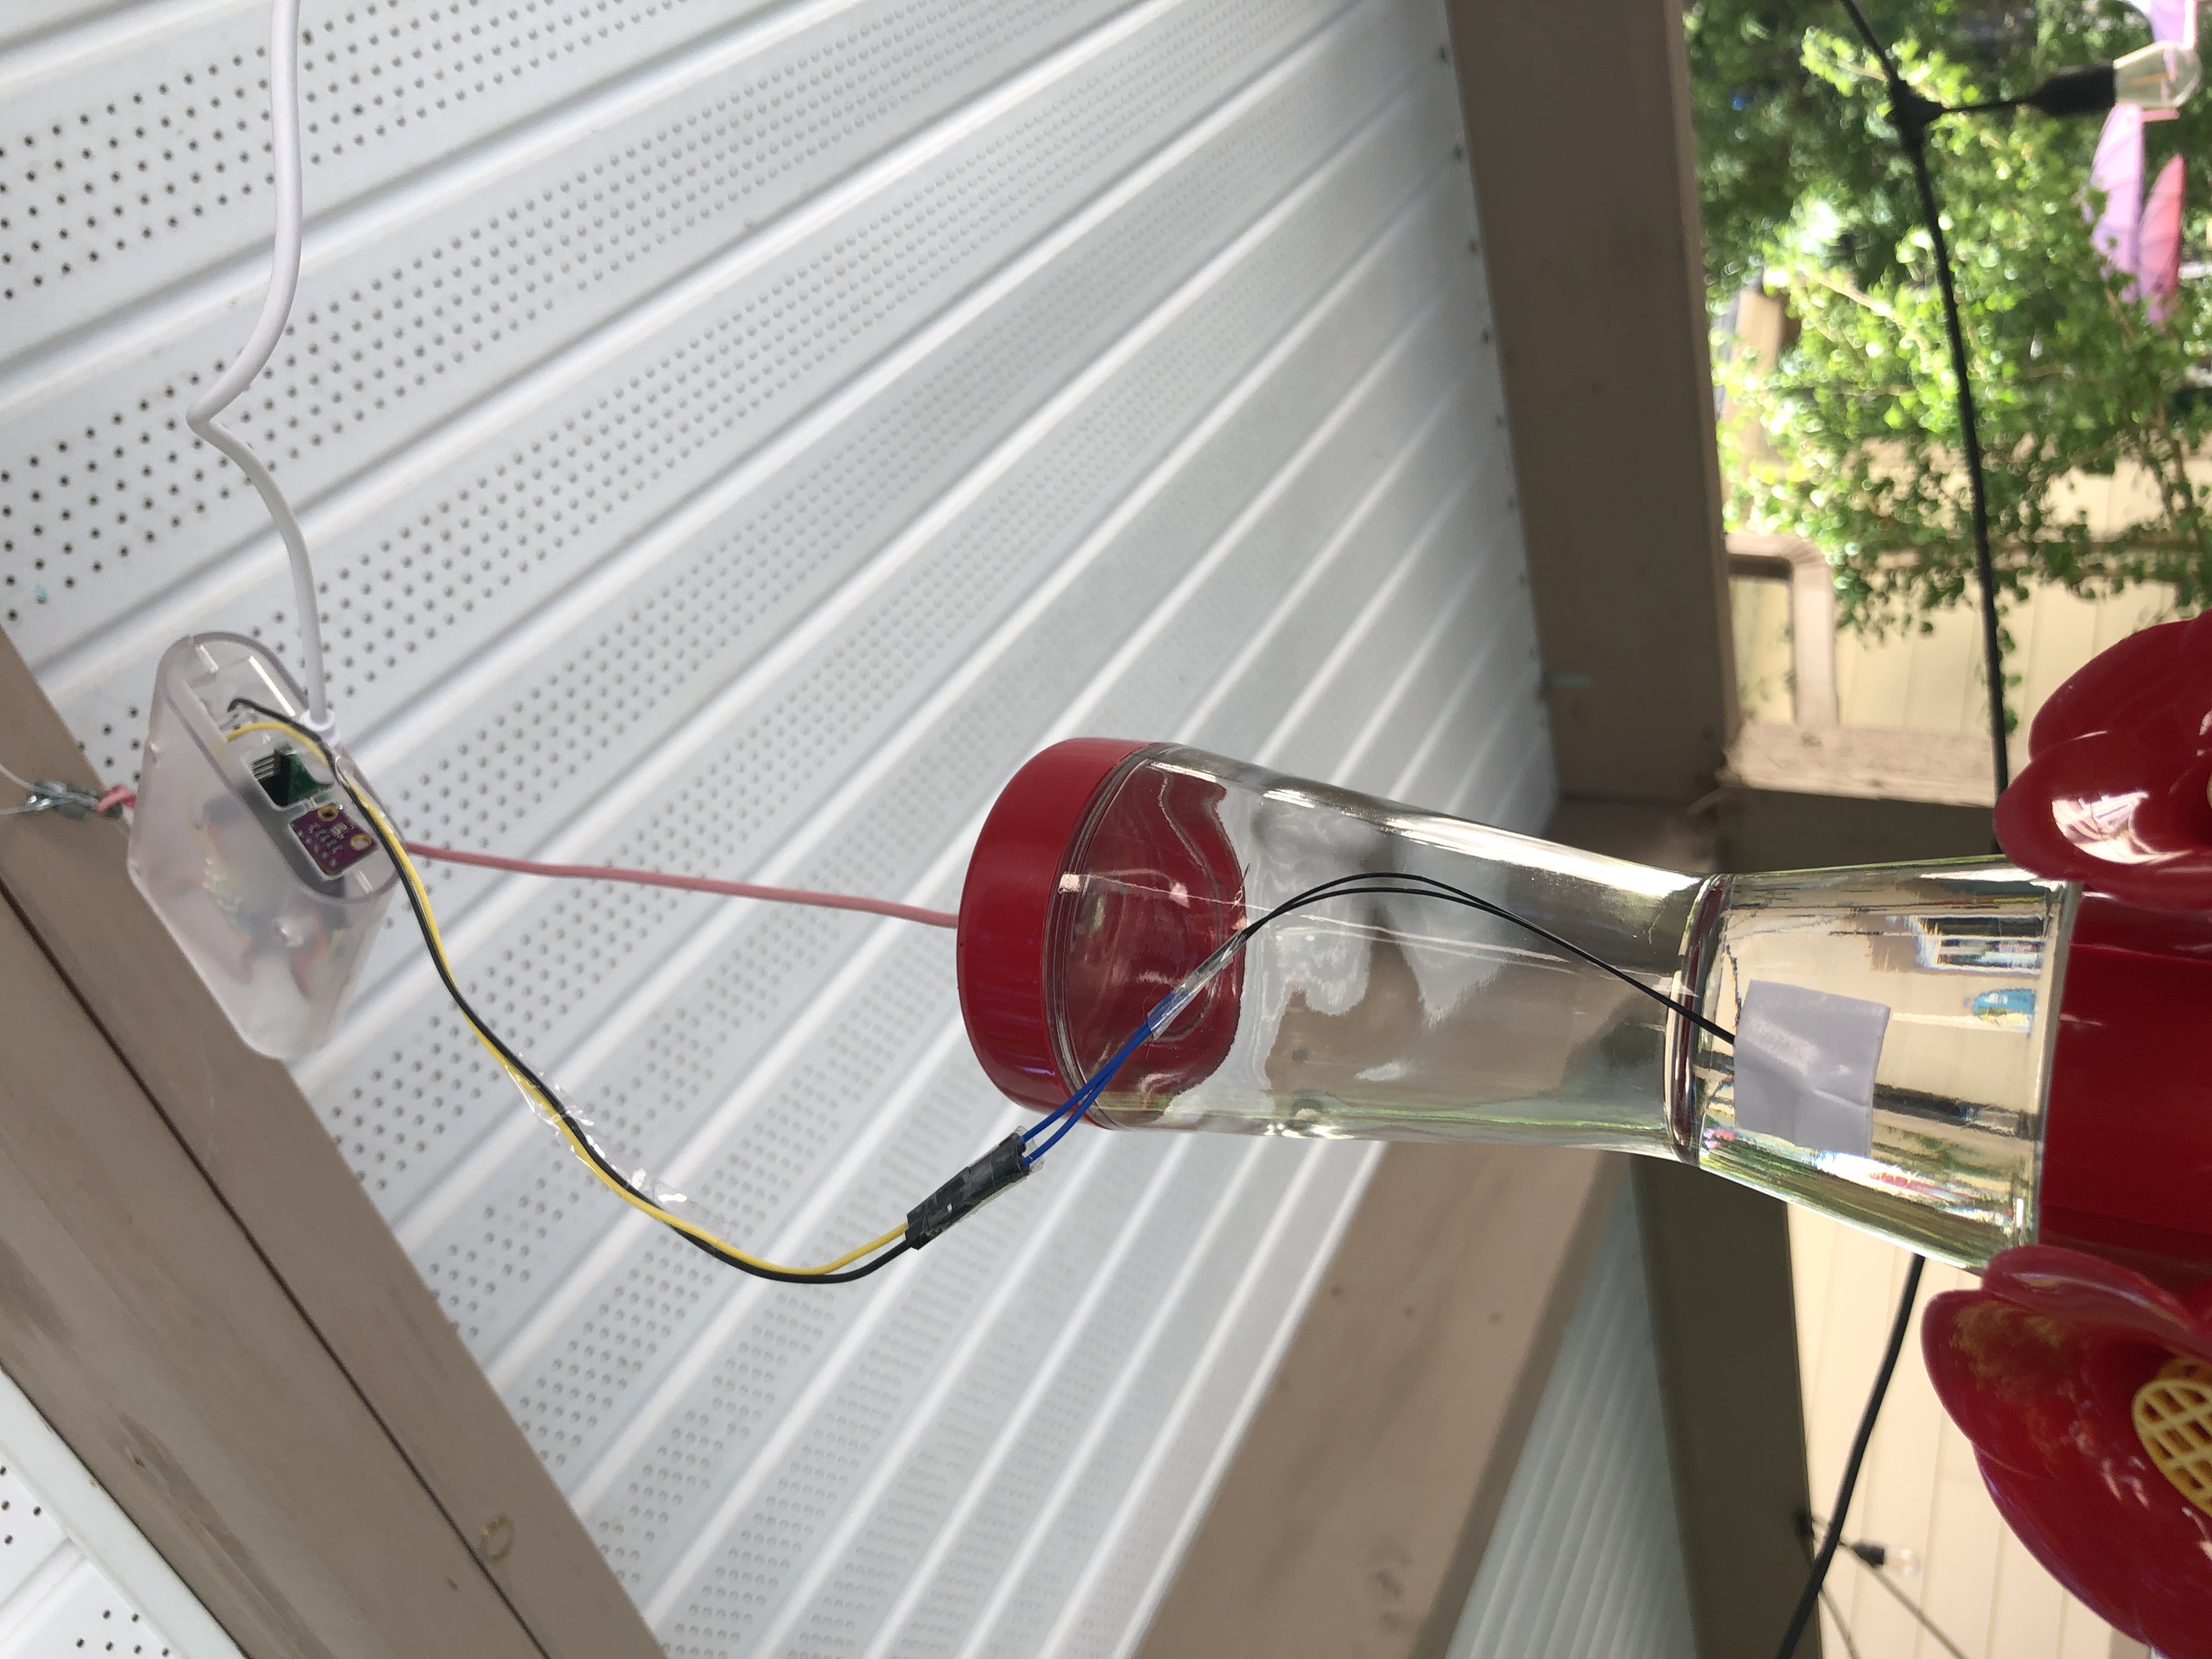
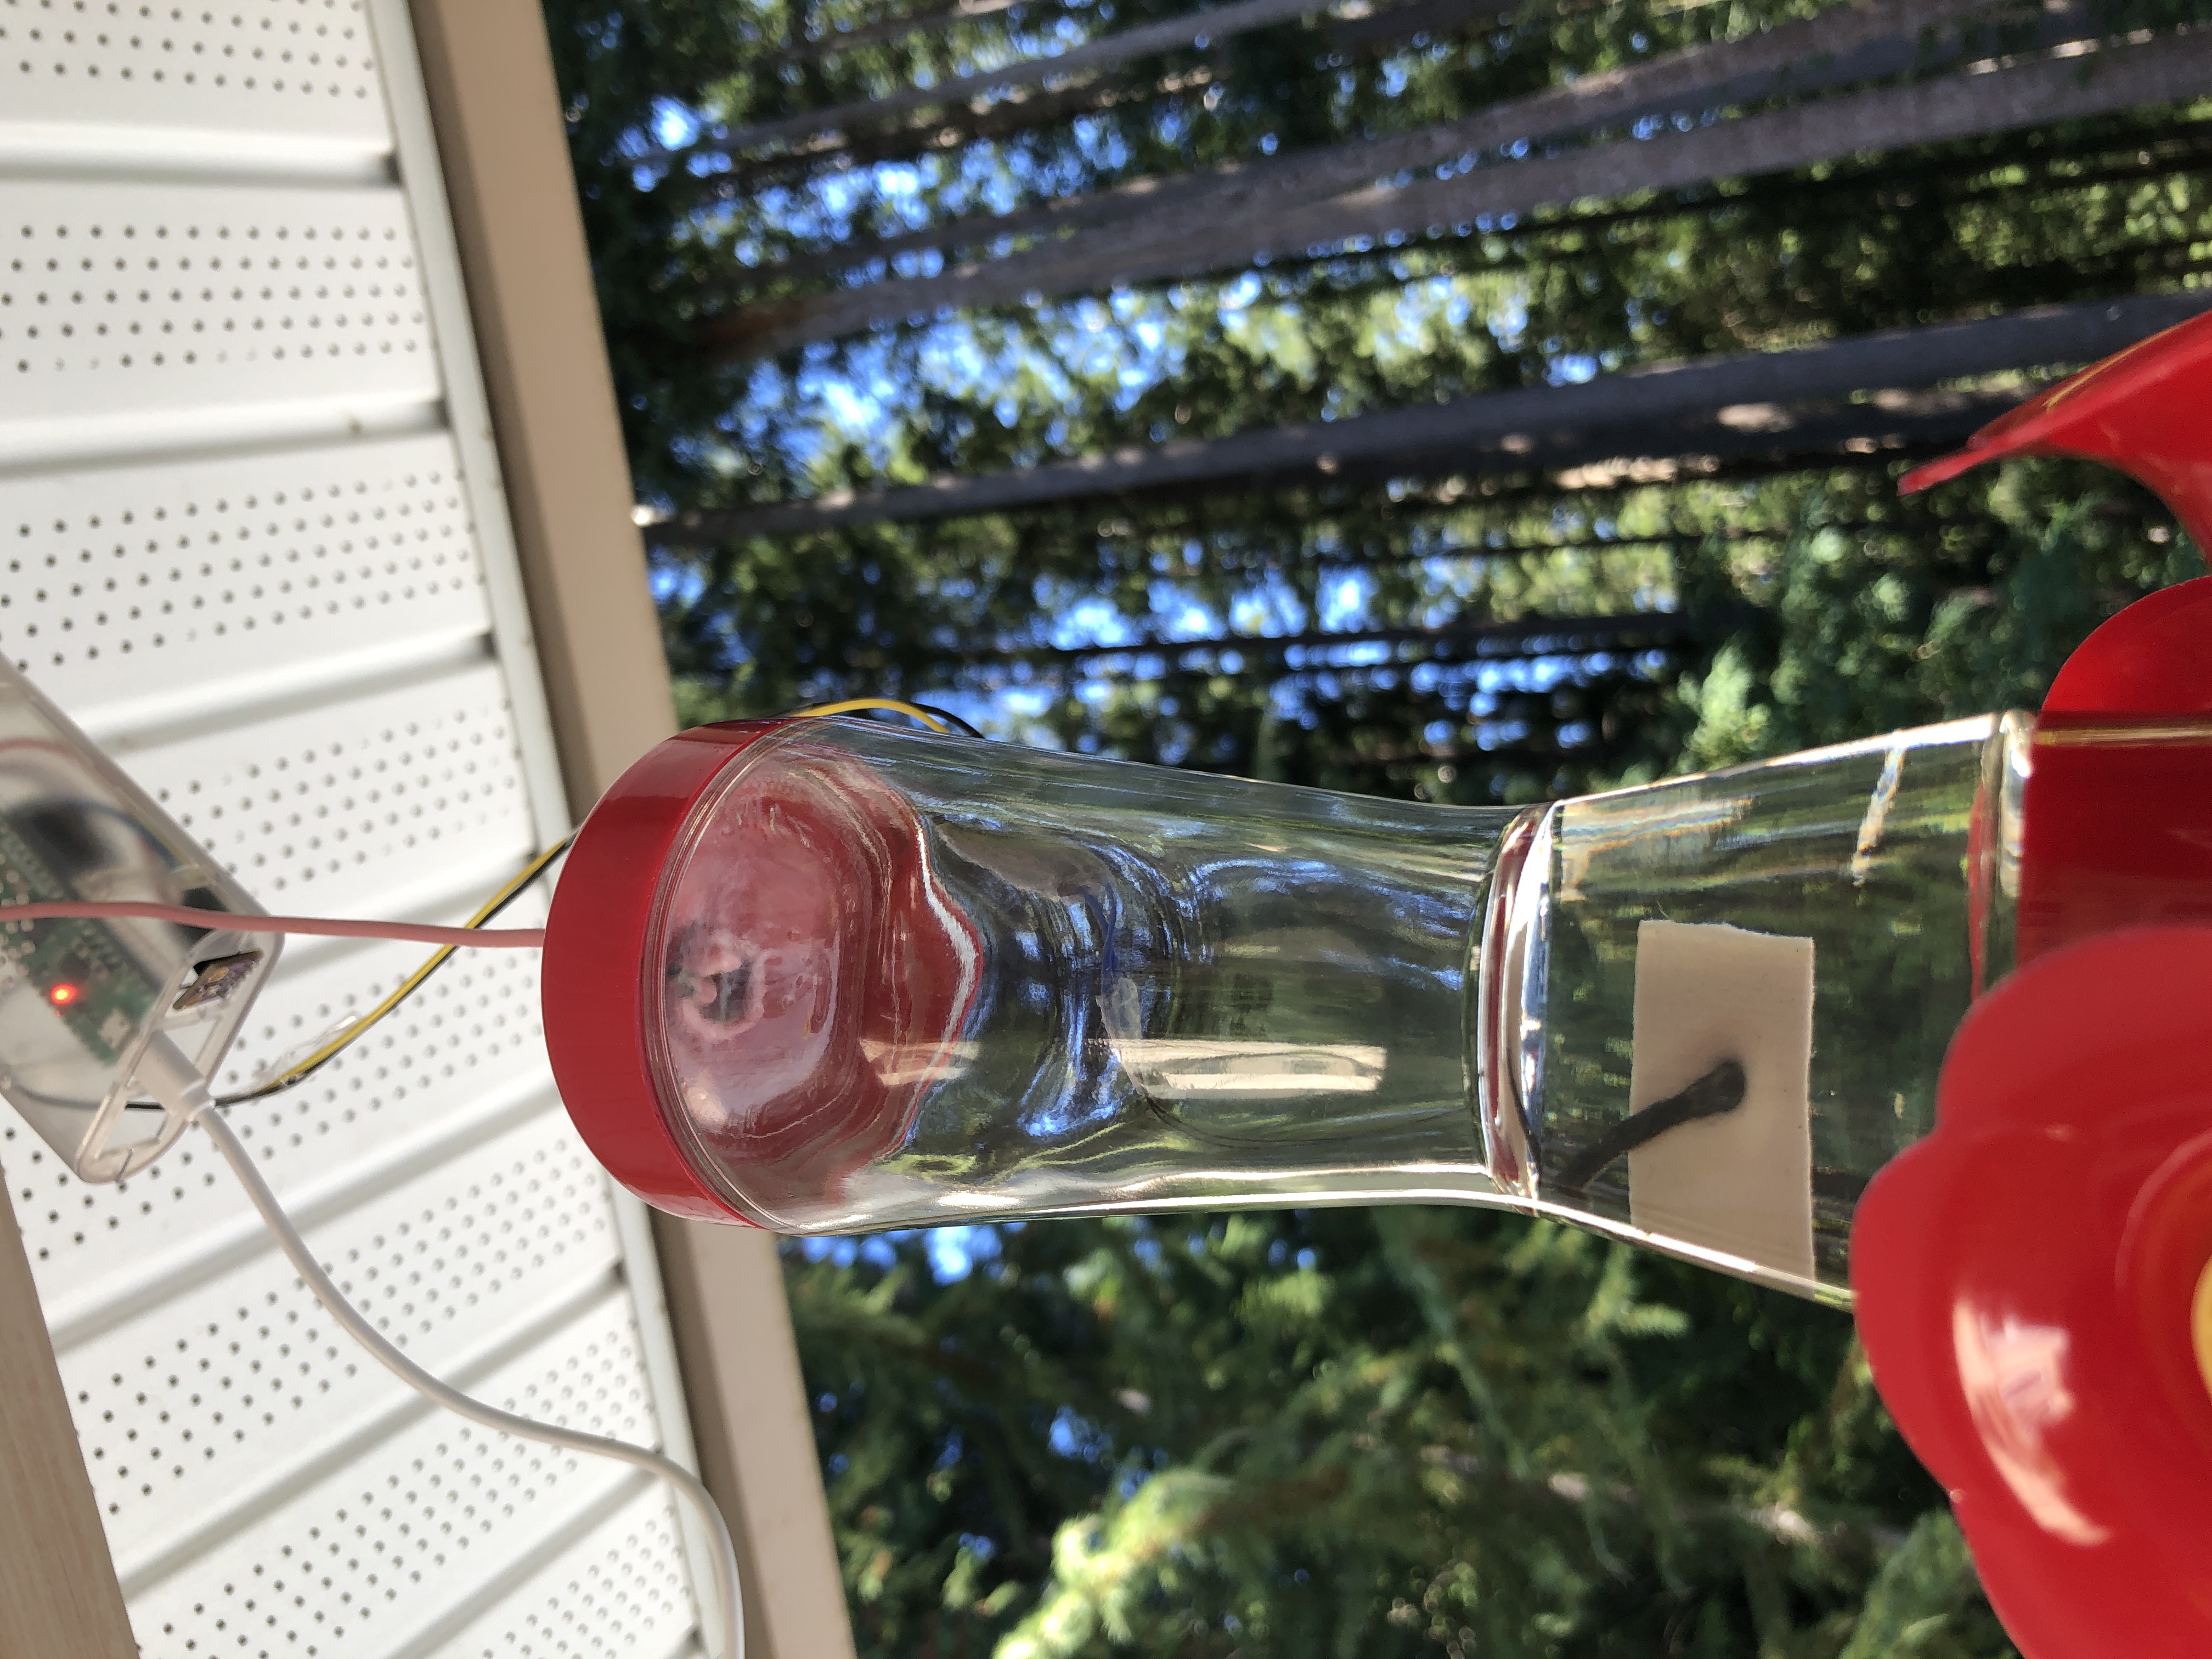
You can see it clearly from the other side, through the glass.
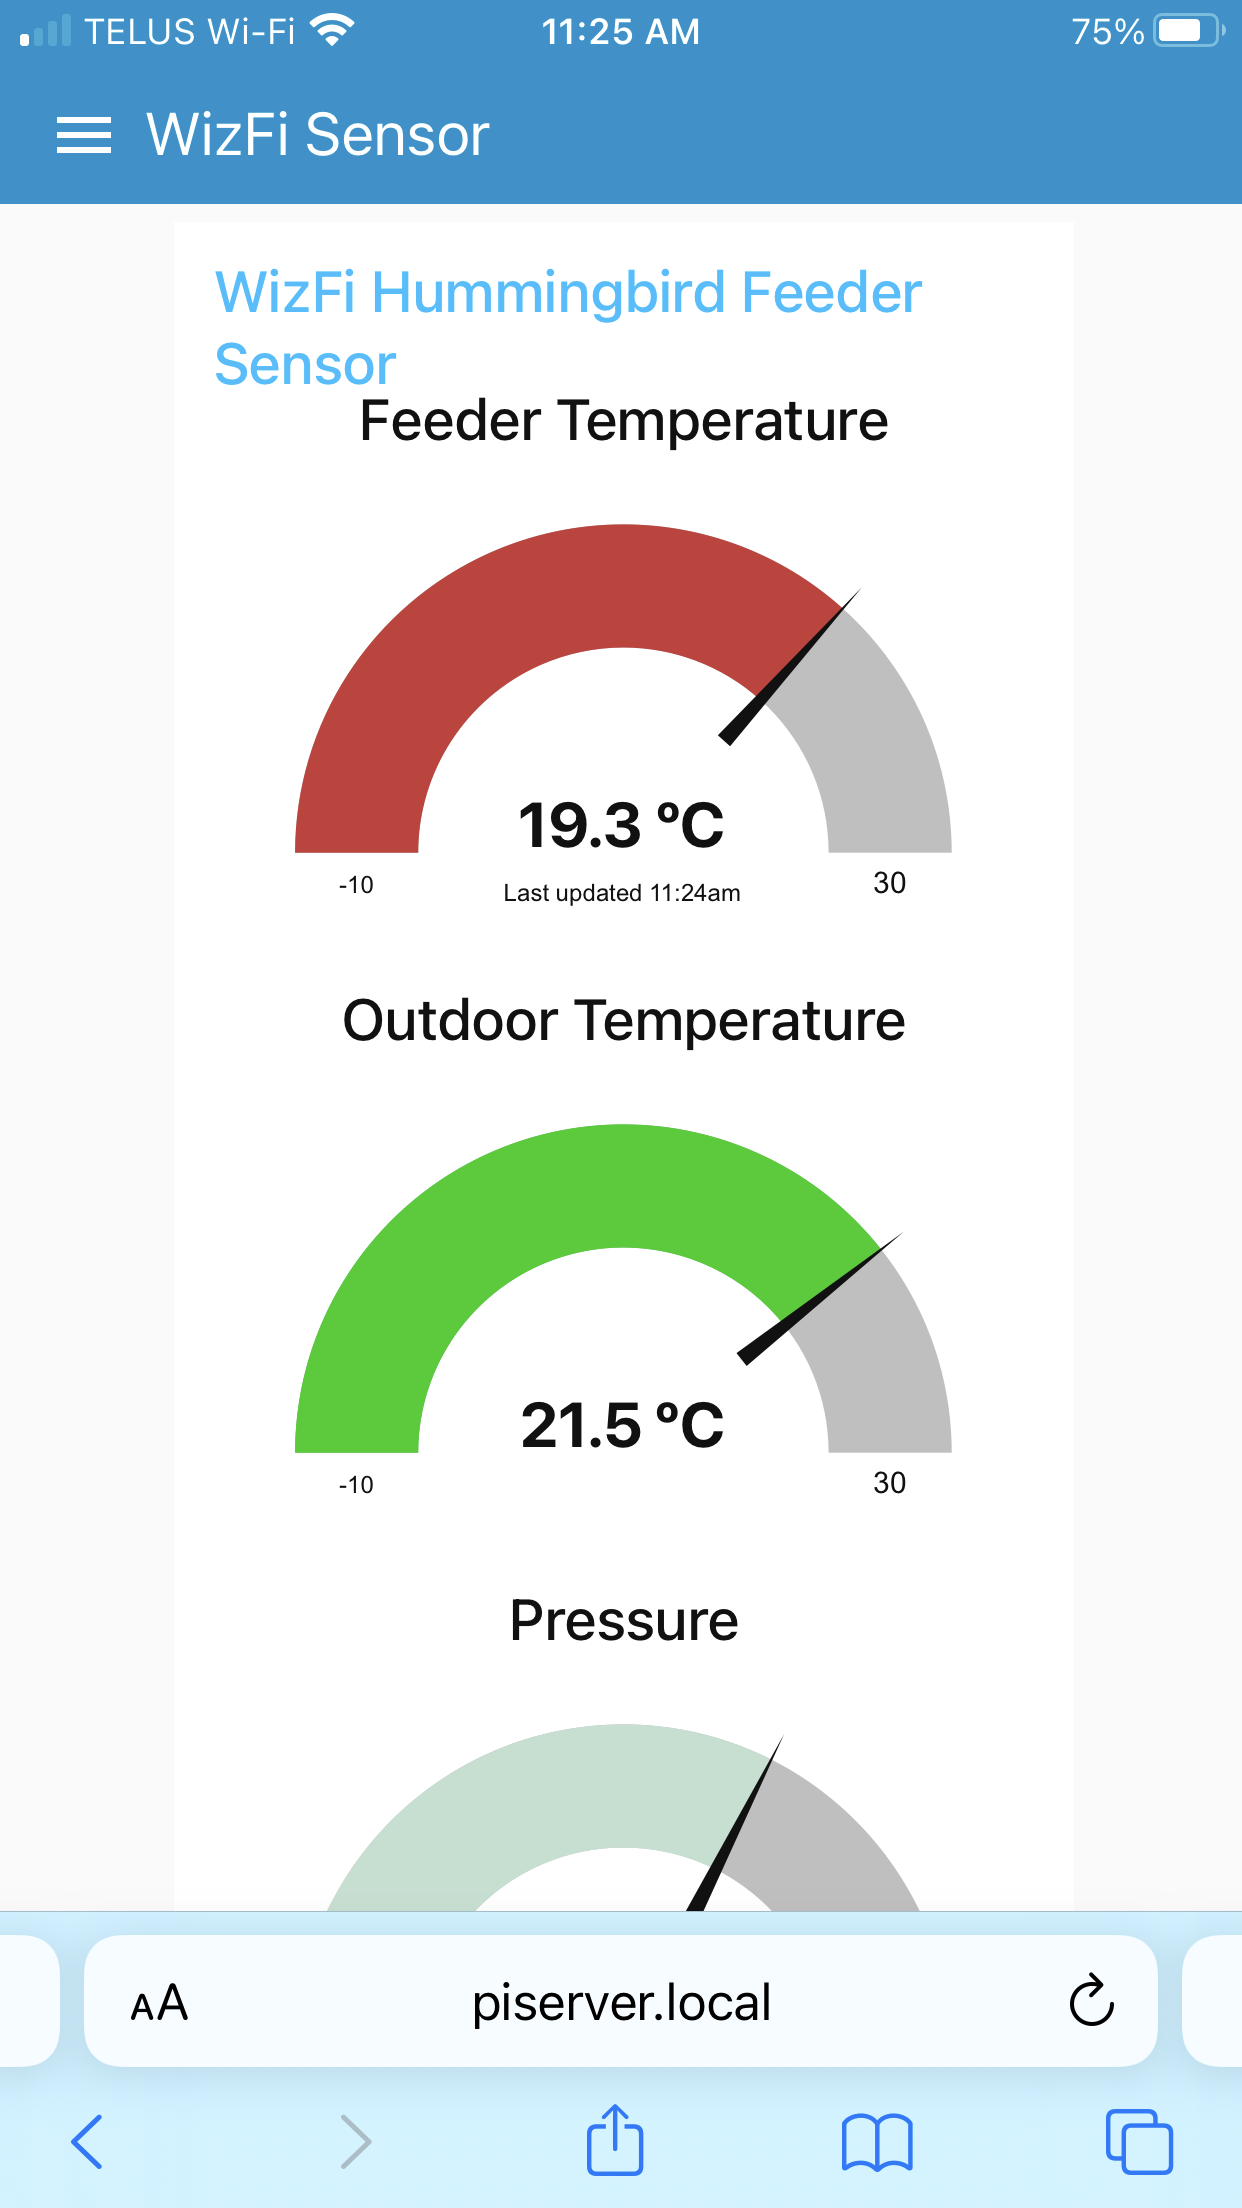
I then used my cell phone to view the sensor information conveniently from anywhere in my house!
I quite enjoyed working with the WizFi360-EVB-Pico for this project.
I did run into a few hiccups, as can be expected with any project, but with a bit or persistence I was able to get my project to work very reliably.
This dev board by Wiznet is a very nice capable little board, and overall it was not too difficult to get some very nice results from it. I also found it to be very stable, with it recording the temperature and weather data uninterrupted every minute of every day for the duration of my testing period.
I hope many of you will find this project useful, and hopefully you'll help me in keeping the little hummingbirds safe during the cold winters!
All the best,
-Nico
-
Node-Red Sensor Flow
This is the exported flow for Node-Red. Import it to see the flow and the details of each node.

-
Arduino Sketch: BME Sensor Test on WizFi360-EVB-Pico
This is the simple sketch I used to test the BME280 with the WizFi360-EVB-Pico, showing results on the serial console.
-
Hummingbird Feeder Monitoring Arduino Sketch
This is the complete final project Arduino sketch.