Wiznet makers

mayuri

Published October 12, 2022 ©

109 UCC

66 VAR

0 Contests

0 Followers

0 Following

Original Link

Water Nitrate Remote Monitoring System with Self-Diagnostic Function for Ion-Selective Electrodes

The detection of nitrate pollutants is a widely used strategy for protecting water sources. Although ion-selective electrodes (ISEs).
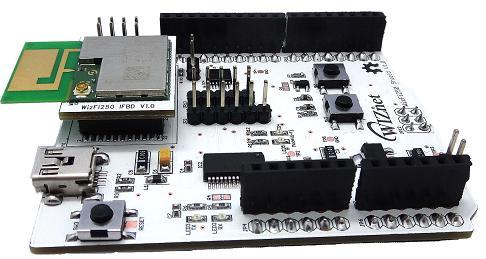
COMPONENTS Hardware components

WIZnet - WizFi250

x 1


PROJECT DESCRIPTION

1. Introduction

In many parts of the world, rapid industrialization and population growth in urban areas have increased the water demand and gradually worsened the water quality owing to the depletion of the water volumes in rivers. The dams and reservoirs, which have been constructed to retain and manage such water resources efficiently, slow down the cycling of the water volumes in the river systems; hence, the pollutants cannot be fully removed, and the water quality degenerates. In particular, the excessive inflow of nutrient salts such as nitrates and phosphates causes multiple problems such as eutrophication, which results in the growth of algal blooms and reduced water availability. Hence, managing these pollutants requires special government-driven management programs [1,2].

2. Materials and Methods

2.1. Configuration of IoT-Based Nitrate Measurement System

The sensor was designed based on the materials and method proposed by previous research [5,6]. A polyvinyl chloride-based membrane was used to fabricate a nitrate measurement electrode. The membrane was prepared using the compositions of tetradodecylammonium nitrate (TDDA), 2-nitrophenyl octylether (NPOE), and high-molecular-weight polyvinyl chloride (PVC), as shown in the Table 1. The NO3−− ISEs were filled with an internal solution of 0.01 M NaNO3 + 0.01 M NaCl. An Ag/AgCl electrode prepared by coating silver wire (99%) with a diameter of 1 mm with Ag/AgCl ink (model 01164, ALS Co., Tokyo, Japan) was immersed as the inner reference electrode. A double junction electrode (Orion 90-02, Thermo Fisher, Waltham, Mass.) was used as the reference electrode.

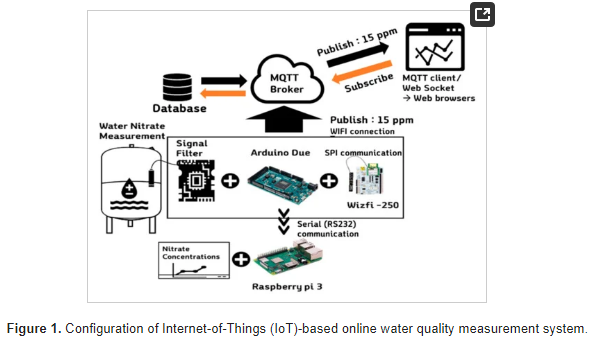
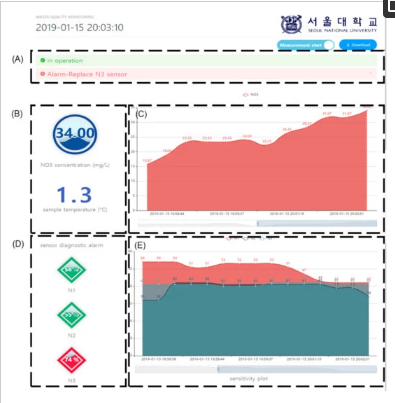
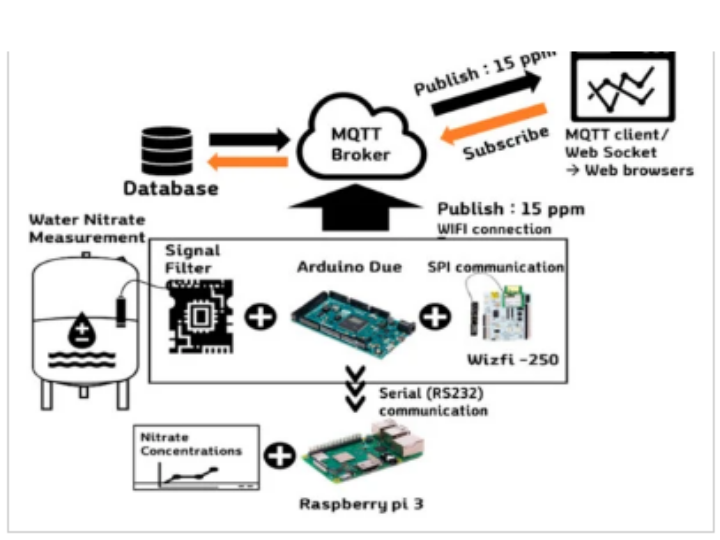
The developed system communicates with the cloud server by using the message queuing telemetry transport (MQTT) protocol and provides monitoring information through the developed web-based monitoring page. A web-based nitrate monitoring page was constructed and tested to monitor measurement data on the web. As shown in Figure 1, the message queuing telemetry transport (MQTT) protocol was implemented through the Arduino Due-embedded board, thereby enabling it to recognize the broker server via the wireless network and to publish data from the three nitrate electrodes [26]. Moreover, the web-based nitrate monitoring page was constructed and tested to monitor measurement data on the web. The data are published on the broker’s own webpage and sent on to the user. The web page was hosted using a commercial cloud server (Naver Cloud Platform, Naver, Seongnam, Korea) and the server configuration was Node.JS, and Vue.JS was used for building a front-end UI.

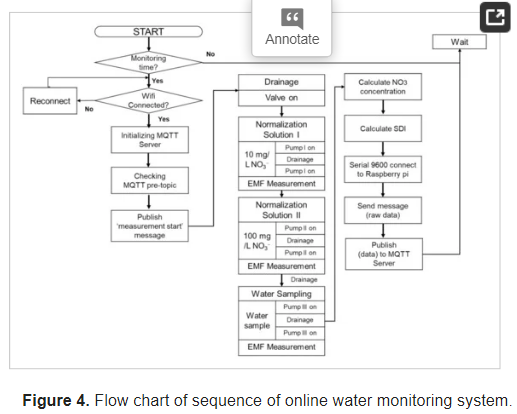
The overall sequence of the developed water nitrate monitoring system with self-diagnostic function is shown in Figure 4. The sequence includes a two-point normalization setup with rinsing, sampling pumps, drainage via a solenoid valve, and measurements with the ISEs, while the data communication processes with the MQTT server and fault diagnosis are presented. The two-point normalization method consisting of a sensitivity adjustment followed by an offset adjustment was used to minimize the potential drift. Two different concentrations of 10 and 100 mg L−1 were used as known standard solutions of low and high concentrations, respectively, to determine the slope and offset values prior to sample measurement. Through this process, the signal drift, sensitivity, and deviation values were obtained for each electrode required for the self-test function.

2.2. Self-Diagnostic Algorithm for ISE

Selection of SDI for Electrode

The change in sensitivity is an essential factor for assessing the performance of the ISE [14]. In addition, the continuous data from sensor signals must be analyzed to determine whether there is a signal drift (which is also an important index for assessing the sensor performance). In this study, the current status of the nitrate electrodes was quantitatively checked using three indicators, i.e., electrode drift index (S1), sensitivity change index (S2), and estimated value change index between multiple electrodes (S3):

The SDI (%) is presented in Equation (4):


2.2. Self-Diagnostic Algorithm for ISE

Selection of SDI for Electrode

The change in sensitivity is an essential factor for assessing the performance of the ISE [14]. In addition, the continuous data from sensor signals must be analyzed to determine whether there is a signal drift (which is also an important index for assessing the sensor performance). In this study, the current status of the nitrate electrodes was quantitatively checked using three indicators, i.e., electrode drift index (S1), sensitivity change index (S2), and estimated value change index between multiple electrodes. 

2.3.3. Evaluation of Self-Diagnostic Methods

The precision, recall, and accuracy of the setup were investigated in this study to determine the effectiveness of the SDI. The factors that evaluate a model can eventually be defined as the relationship between the model’s predicted and actual correct label. The result is classified into “True and False”; thus, the classification model outputs “True” and “False”, thereby dividing the results into a 2 × 2 matrix (Table 2) [27].

3. Results

3.1. Lab Test Results Following Application of SDI

The effectiveness of the developed online monitoring system and self-diagnostic algorithm was tested by continuously measuring a sample in the laboratory setting for three days. The repeated measurements of the samples with an NO3 concentration of approximately 17.85 mg/L according to the standard analysis resulted in an average NO3 concentration of 15.51 ± 3.38 mg/L, which is similar to that of the real samples. The results are presented in Figure 6; the predicted NO3 concentrations of each electrode are plotted in Figure 6A, and the corresponding SDIs in Figure 6B–D are the SDIs of each electrode. In the test, an SDI of 70 or higher indicated the optimal time for the replacement of the electrode. In the case of NO3 electrode 1 (filled circles, Figure 6A and bar chart in Figure 6B), the SDI exceeded 60 on Day 21 and 70 on Day 24, at which point the electrode was replaced. In the case of NO3 electrode 2 (open circles, Figure 6A and bar chart in Figure 6C), the SDI reached 68 on Day 9. On that day, the bubbles on the electrode membrane were removed by the experimenter, and the SDI recovered to its original value. On (approximately) Day 13, the electrode showed a decrease in its sensitivity and a change in the drift, as shown in Figure 7 (open circles). On (approximately) Day 22, the electrode 2 was replaced because the SDI was approximately 79. By contrast, the NO3 electrode 3 (filled triangles, Figure 6A and bar chart in Figure 6D) exhibited a sensitivity of approximately 37 on Day 1, which indicates a change in the sensitivity of the membrane compared to those of the other electrodes (Figure 7). Consequently, the electrode was replaced when the SDI exceeded 75. The electrode sensitivity momentarily decreased 11 days after the replacement. Accordingly, the electrode was replaced again.

3.2. Learning Results of Deep Neural Network-Based Diagnostic Model for Electrode Status

As shown in Figure 8, the web-based nitrate monitoring page was constructed and tested to monitor the measurement data and provide the following three types of information: (i) the current nitrate concentration (Figure 8B) was monitored and plotted as a continuous graph over time (Figure 8C); (ii) the change in the sensitivity of each electrode in Figure 8E indicates the SDI (Figure 8D); (iii) based on this value, an alarm message was generated when the electrode had to be replaced (Figure 8A). In Figure 8C, a relatively rapid change in NO3 concentration is observed for a short period of time, which might be affected by the detection of an abnormality in the N3 electrode.

4. Discussion

Although ISEs have received great attention as water quality measurement devices owing to their fast reaction and user friendliness, many researchers have reported frequent failures in field applications [28,29,30]. When the measurement target is not sufficiently accessible, the sudden failure of the ISE cannot be dealt with immediately, which may result in the loss of effective data and problems in the water quality management owing to false information. This paper proposes an algorithm that diagnoses the status of ISEs, displays the replacement time, and verifies its own effectiveness. It has been reported that an error in the measurement system may occur due to changes in external temperature or changes in the electrode itself when the actual ISE electrode is applied in the field [6,7]. The proposed SDI is an empirical index that reflects electrode drift, sensitivity change, and precision of expected values and obtained 77% accuracy for electrode conditions as a result of field experiments. In addition, the recall for the probability of an electrode malfunction was about 87%, which was used as an indicator to deliver an effective alarm. In addition, the two-point normalization method was applied to record the SDI index and to compensate for changes in the sensitivity of the electrode. It could additionally be expected to reduce the temperature change that affects the potentiometric measurements with ISEs.

5. Conclusions

In this study, an online measurement system was developed to identify the reliability and durability of a nitrate-selective electrode for sensing and measuring nitrate concentrations in real time. The proposed diagnostic algorithm can determine the electrode replacement time with the help of SDIs, which reflect the sensitivity change and signal drift of the electrode. The SDI method was effective in the laboratory-scale repetitive measurements; it signaled that an electrode needed to be replaced when the SDI reached 70. This SDI-based diagnosis algorithm was applied in an actual experiment; the accuracy of classification was 0.77.
The developed online wireless nitrate monitoring system and electrode diagnostic algorithm were used in a field application test. The monitoring and web-based alarm systems were successfully implemented, the electrodes were successfully replaced, and unidentified high-concentration events were detected. Hence, the developed monitoring system and electrode diagnostic algorithm can help with identifying the causes of water pollution.
Documents
Comments Write