
Reliable Remote Management of REPACSS Cluster (Telemetry v1)
Dual-ESP32 rack telemetry node with heartbeat failover. Sends UDP/JSON over WIZnet W5500 Ethernet to a Radxa backend designed for PostgreSQL/Grafana.
Thumbnail image: AI-generated image
Reliable Rack Telemetry with Active/Standby ESP32 Nodes over WIZnet W5500 (UDP/JSON → Radxa)
Introduction
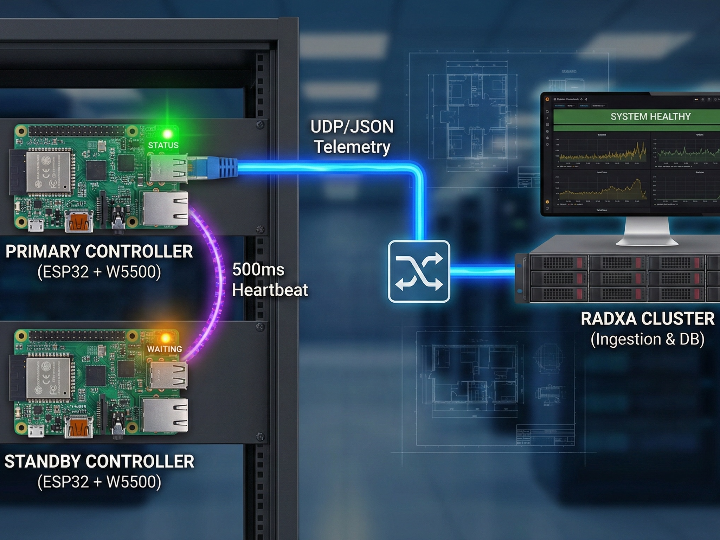
Reliable_Remote_Management_REPACSS (Telemetry v1) defines a rack-level telemetry subsystem designed to keep reporting even when a controller fails. The design uses two ESP32 controllers per rack—an active Controller A (Primary) and a standby Controller B (Standby)—and sends telemetry to a Radxa cluster as UDP JSON over wired Ethernet using a WIZnet W5500 module. (GitHub)
Telemetry, in plain English
AI-generated image
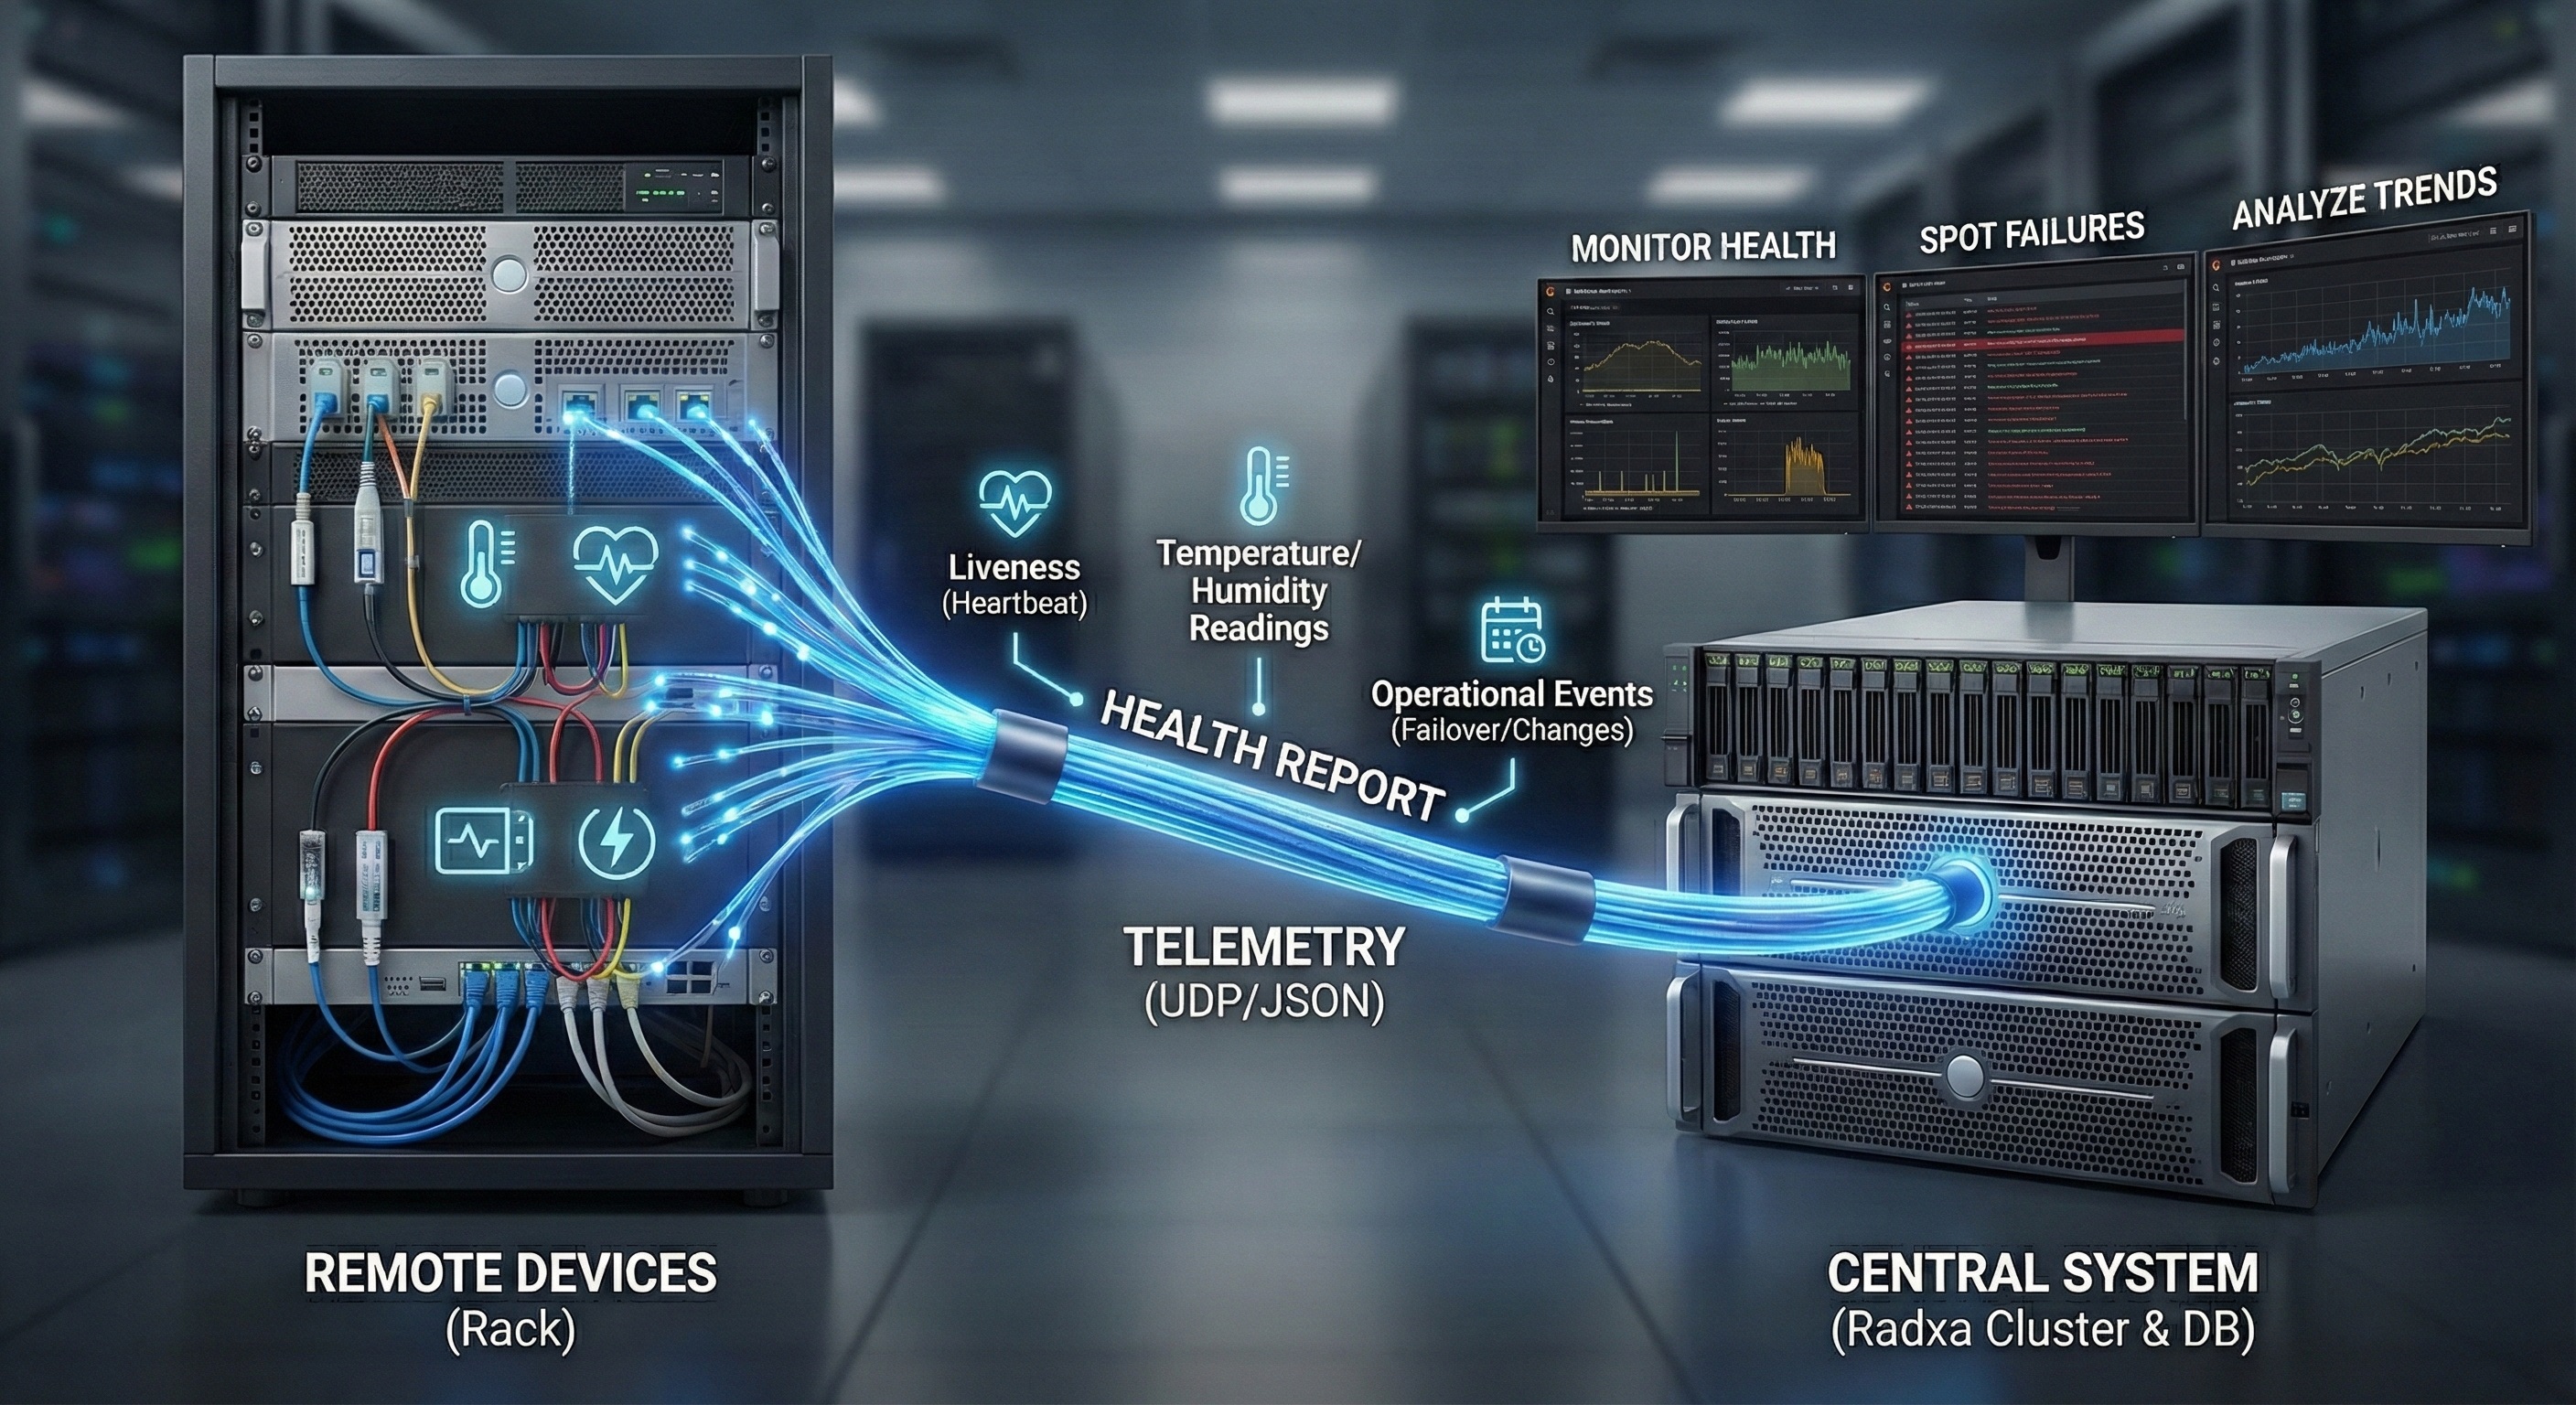
“Telemetry” is simply the automatic collection and transmission of measurements and status from remote devices to a central system so operators can monitor health, spot failures, and analyze trends. IBM summarizes telemetry as automated data collection and transmission from distributed/remote sources to a central system for monitoring and analysis. (IBM)
In this project’s context, telemetry is the rack’s “health report”: liveness (heartbeat), sensor readings (e.g., temperature/humidity), and operational events (failover/network changes). (GitHub)
What this project is
AI-generated image
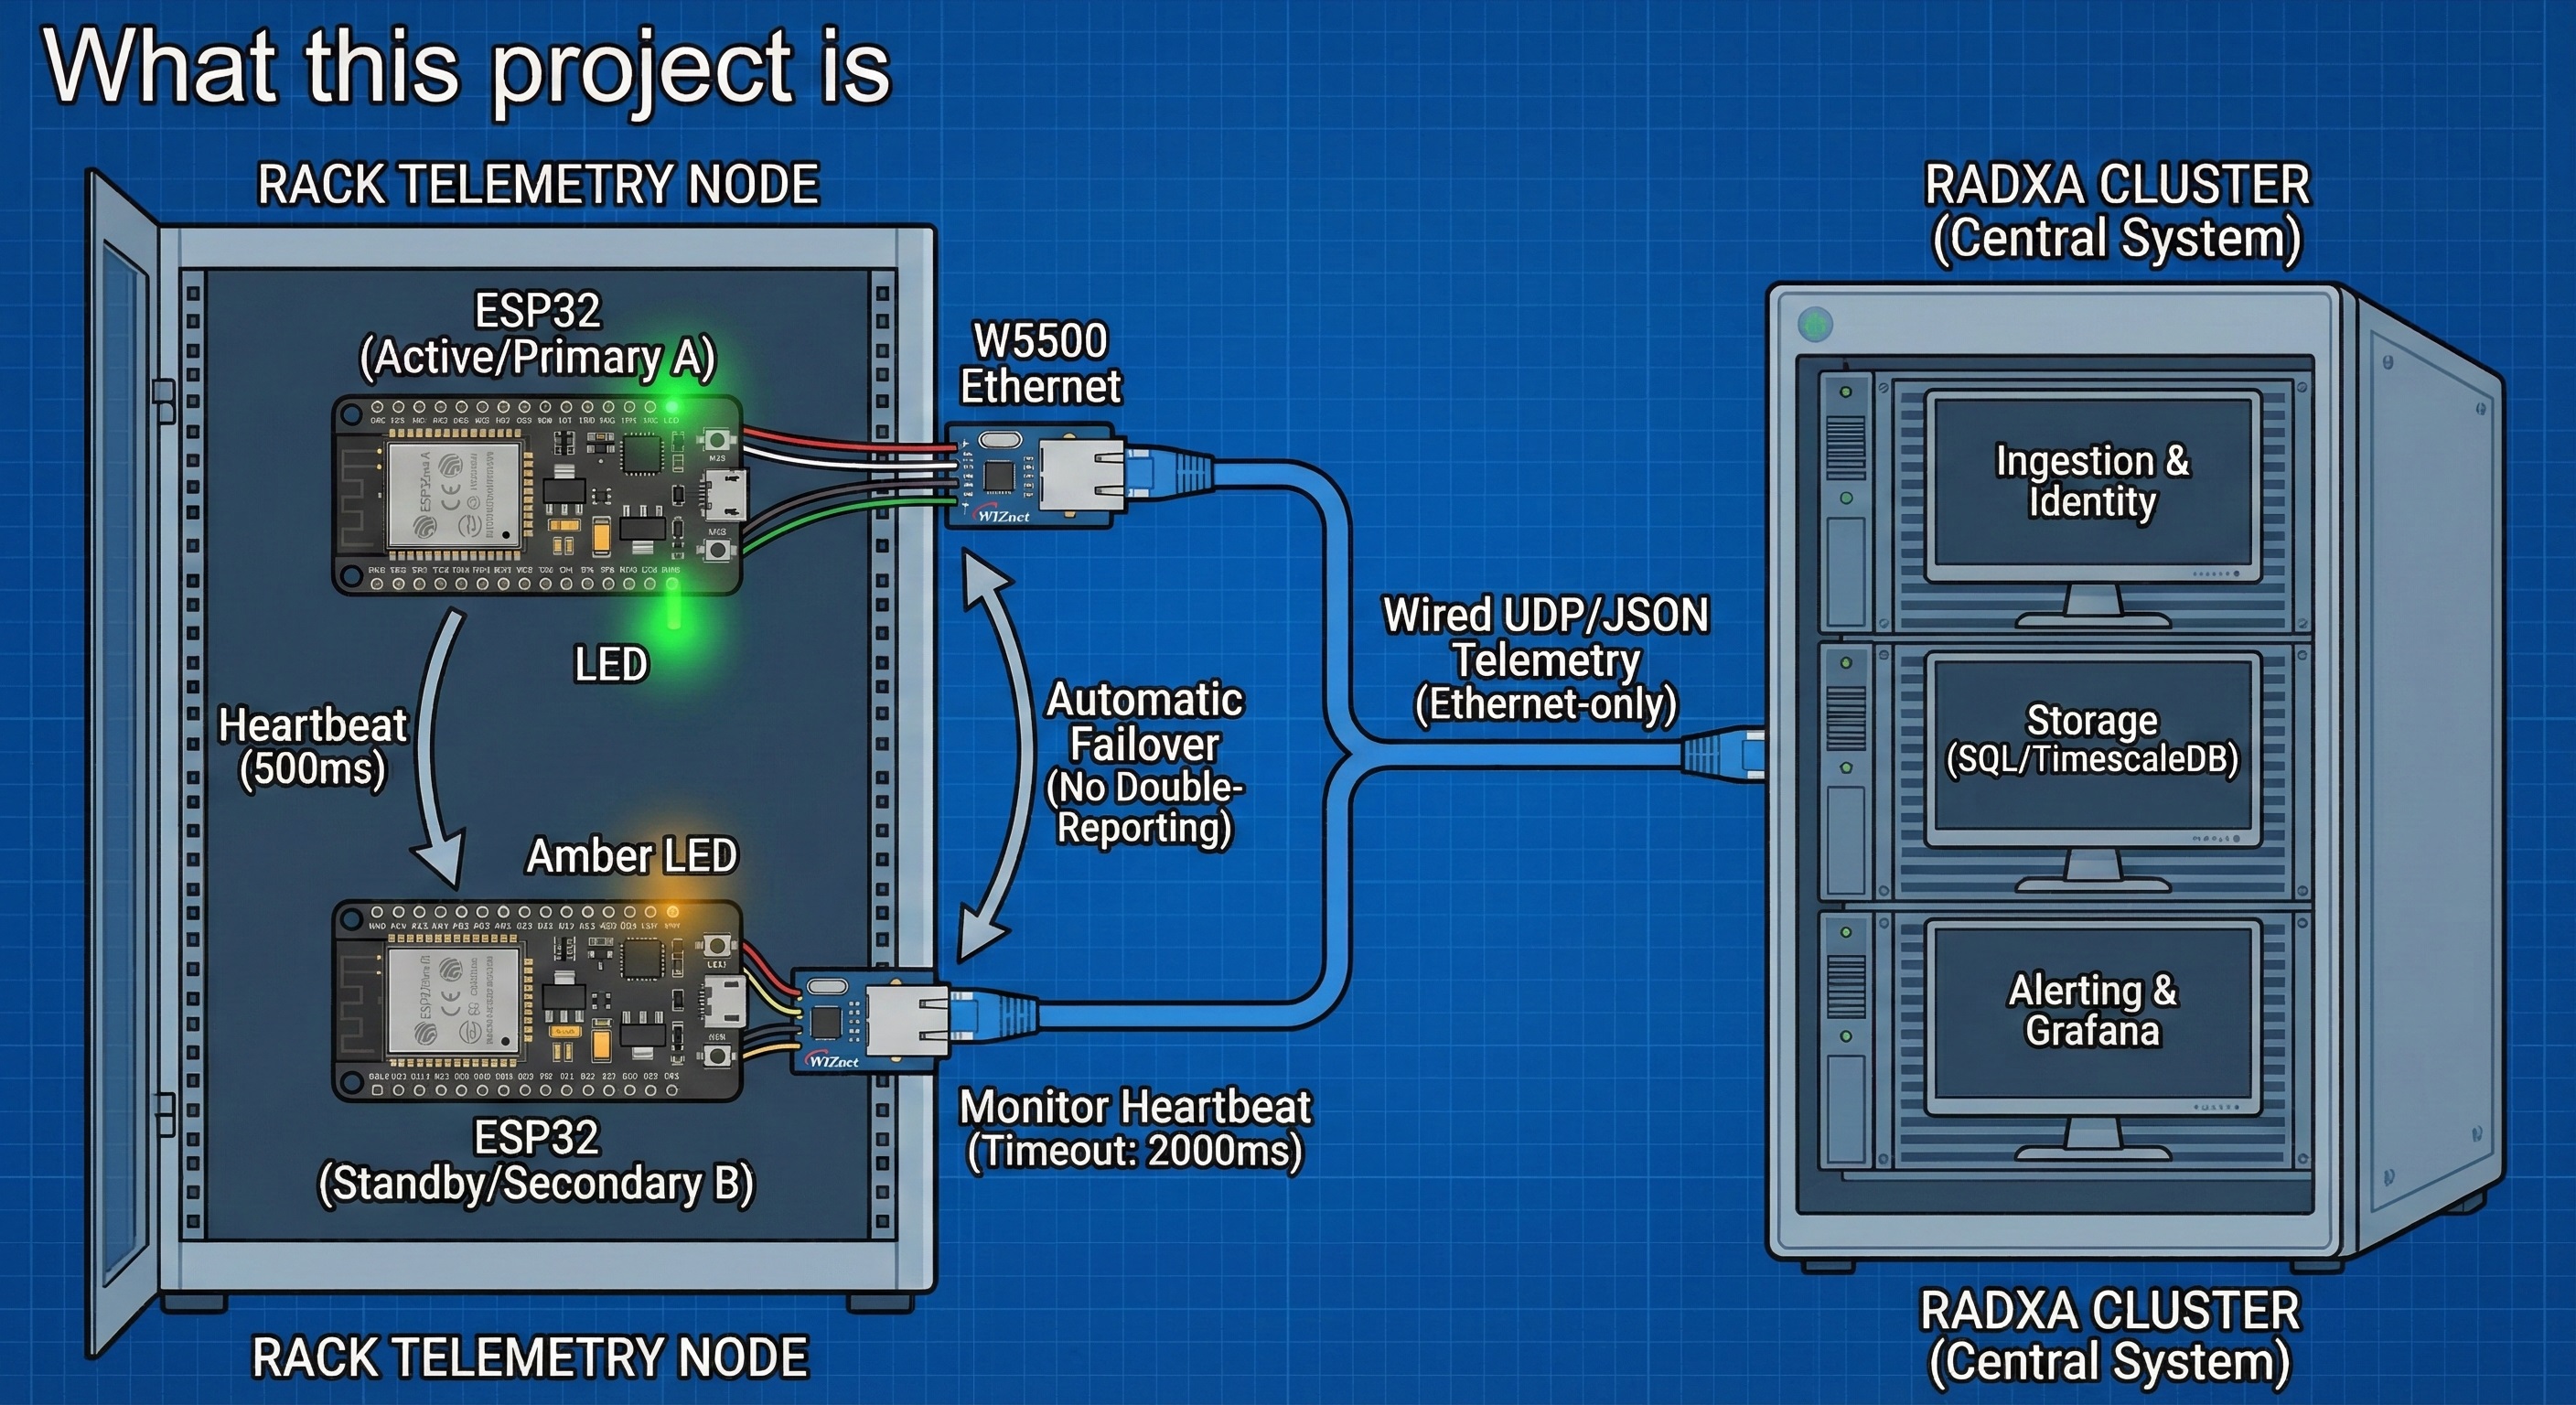
- High-availability rack telemetry pattern: two ESP32s per rack with automatic failover based on heartbeat timeouts. (GitHub)
- Deterministic transport choice: Ethernet-only in this version, explicitly framed as a reliability decision, using W5500 and UDP to a single Radxa IP. (GitHub)
- Operational back end scope: the Radxa cluster is specified as the central ingestion, identification, storage, and alerting authority, with a SQL database and Grafana-friendly access patterns. (GitHub)
- Repository structure: the repo shows an
ESP32-Firmware/directory and a connection guide markdown file, in addition to the README spec. (GitHub)
Author & Community
Published as a public GitHub repository by TalkingJupiter. At the time of review, the repository shows 1 star and 8 issues, which suggests it’s early-stage but actively being iterated. (GitHub)
https://orcid.org/0009-0005-5327-2485

Source: https://orcid.org/
How it works
AI-generated image
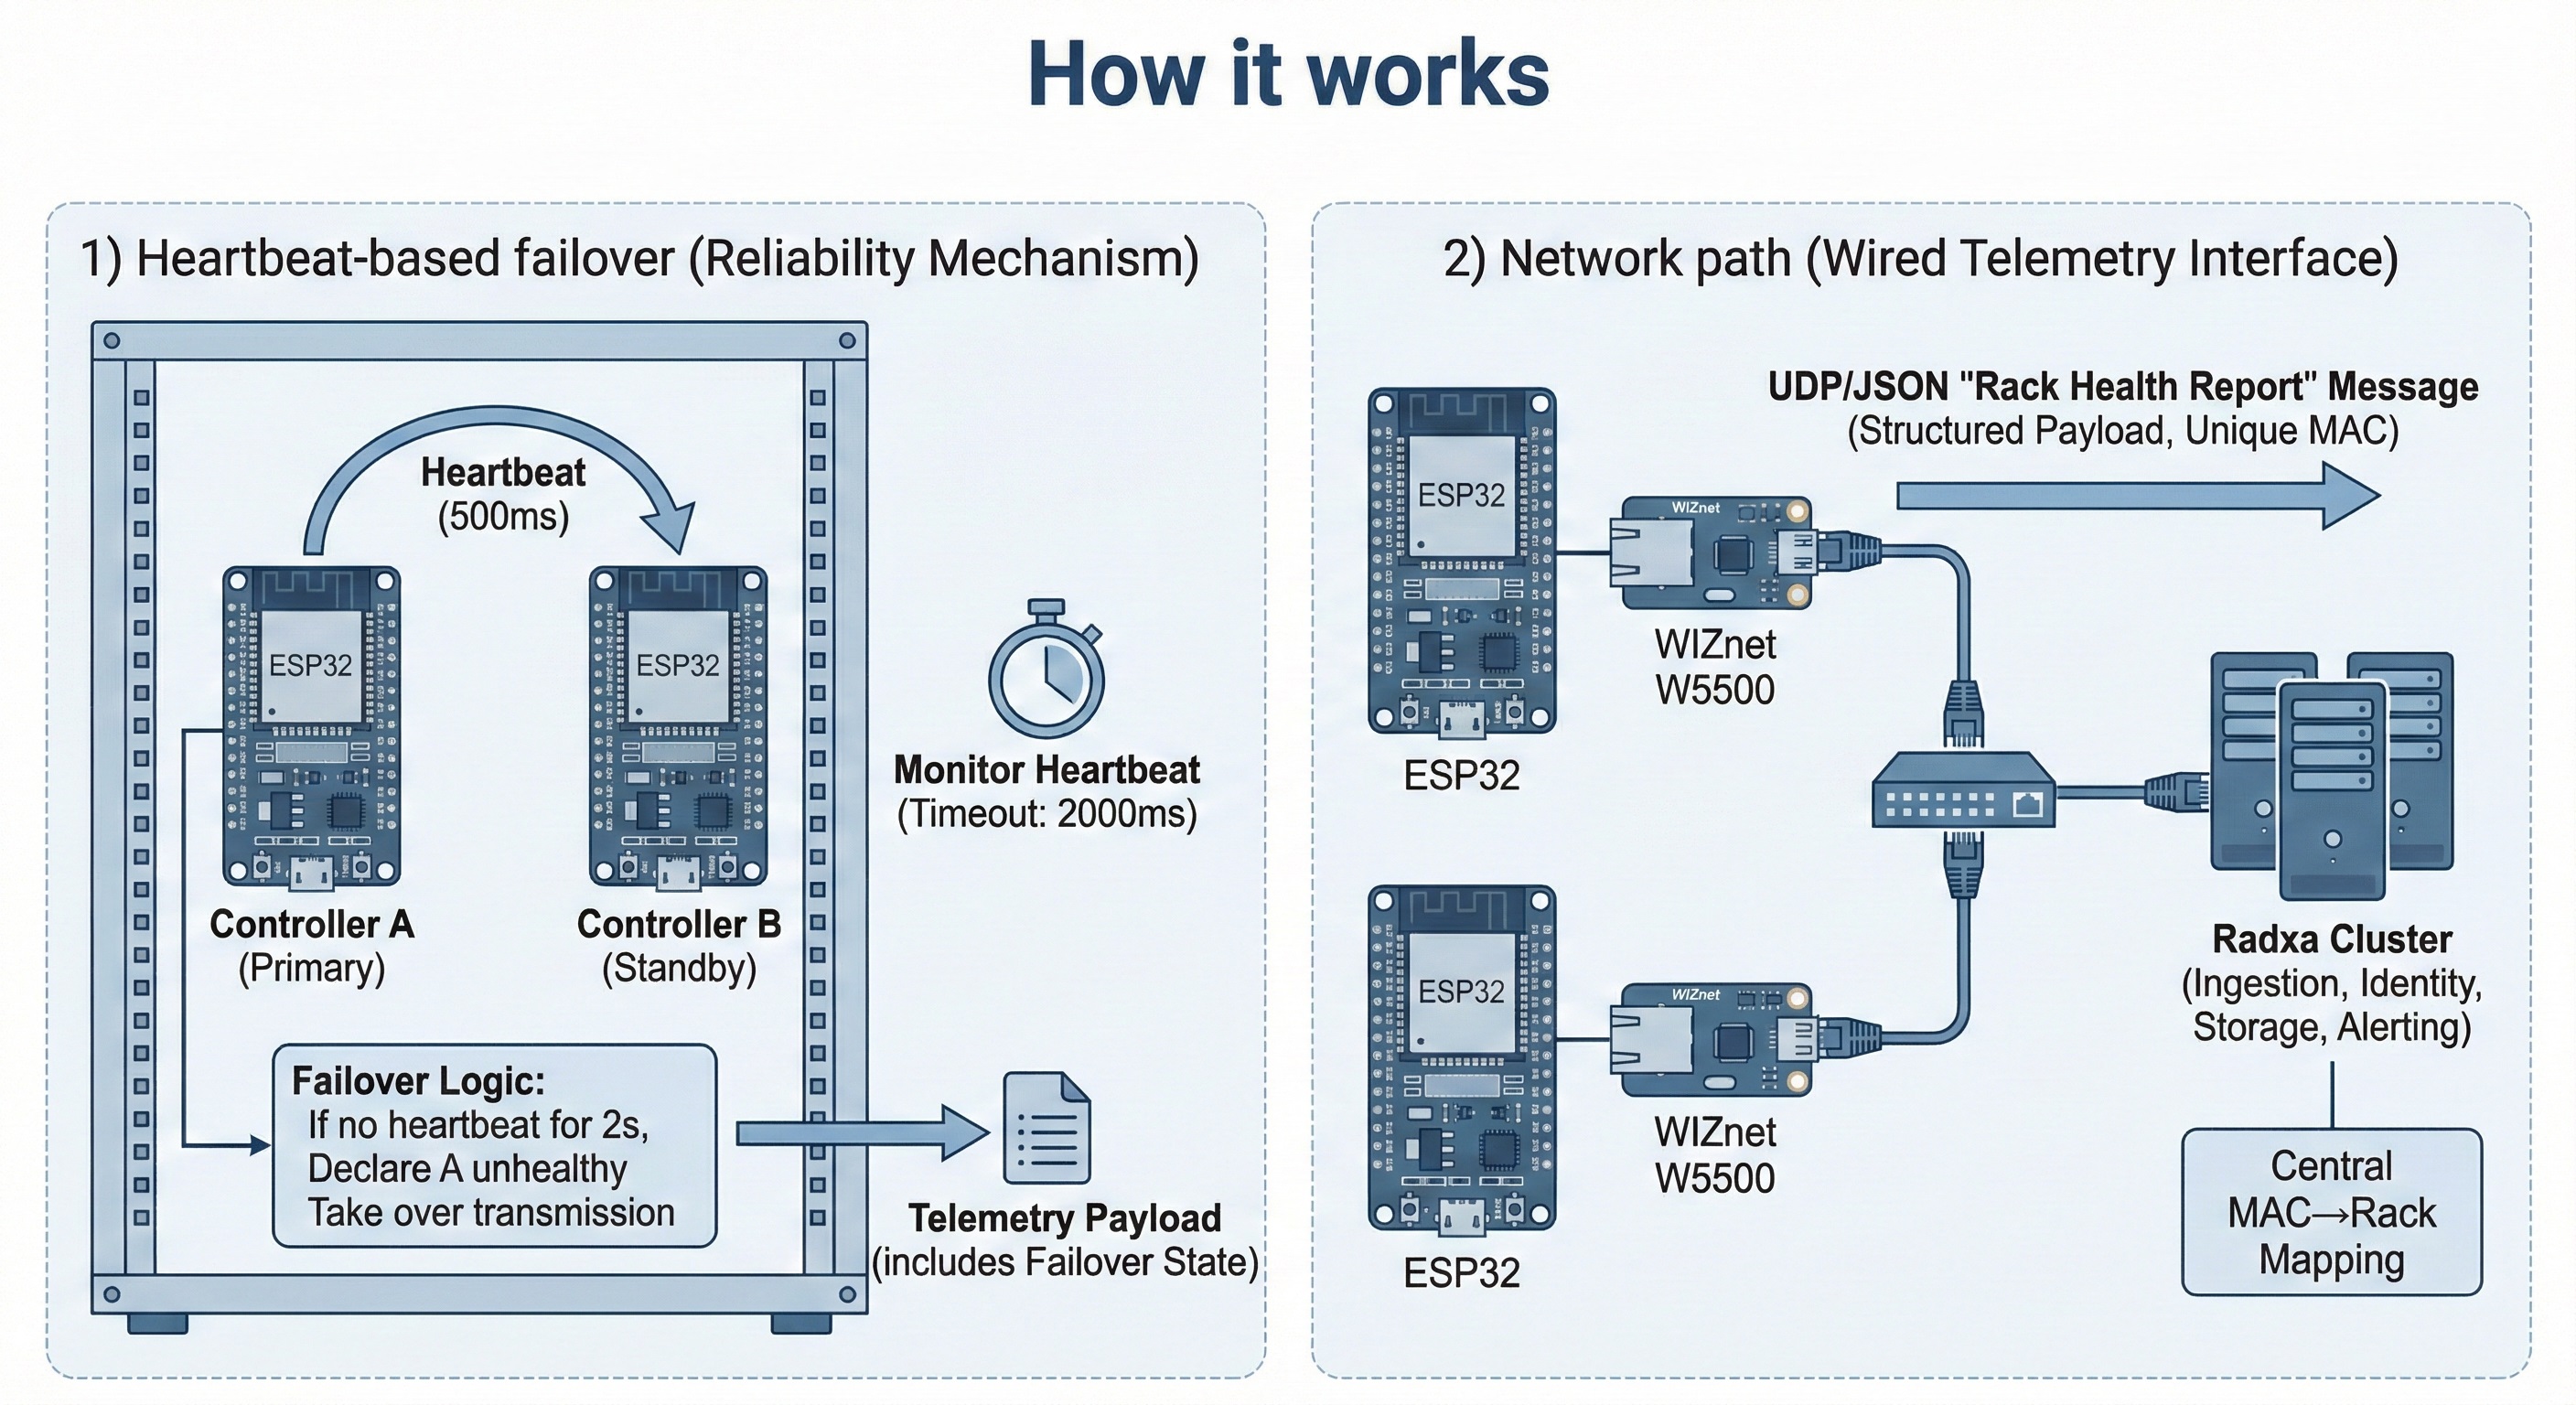
1) Heartbeat-based failover (the core reliability mechanism)
The failover logic is specified in concrete timing terms:
- Controller A emits a heartbeat every 500 ms.
- Controller B monitors that heartbeat continuously.
- If B receives no heartbeat for 2000 ms, it declares A unhealthy and takes over telemetry transmission automatically.
- Failover state is included in the telemetry payload so the back end can record and alert on it. (GitHub)
A “critical rule” prevents double-reporting: B must remain silent while A is healthy, only transmitting after A fails, and stopping again when A recovers. This is a small rule with big operational value—one rack should look like one reporting source unless a switchover occurs. (GitHub)
2) Network path: WIZnet W5500 as the wired telemetry interface
Telemetry v1 explicitly chooses Ethernet-only transport for “deterministic, reliable” delivery, and it explicitly mandates a W5500 Ethernet module. Messages are sent as UDP to a single Radxa IP, and each message includes a unique MAC address for device identity. (GitHub)
From a WIZnet perspective, this is a clean match for W5500’s lane: W5500 is a hardwired Internet controller with an integrated TCP/IP stack and support for UDP, with 8 sockets and 32KB internal memory, intended to simplify Ethernet application development over SPI. (WIZnet)
In this design, the W5500’s job is straightforward: provide a stable wired link so the ESP32 can focus on state machine + sensor + failover logic, while the back end receives a consistent stream of small UDP “health report” packets. (GitHub)
3) Payload model: one structured “rack health report” message
The README defines a minimal schema and shows an example structure. Each telemetry message includes:
message_type(telemetry)device.mac- a device timestamp
- an
items[]list that combines heartbeat, sensor readings, and failover/event data (GitHub)
This “single structured message” approach is practical for ingestion: the Radxa side can validate the envelope, then route/store sensor samples and events without coupling tightly to a single firmware build. (GitHub)
4) Scaling operations: central MAC→rack mapping and “unknown device” handling
Instead of hardcoding rack IDs into firmware, the design makes the Radxa cluster the source of truth for mapping MAC → rack_id. Unknown MACs are not dropped—they’re stored and labeled as unassigned/unknown, and the alert policy is intentionally rate-limited to a daily summary when unknown devices are observed. (GitHub)
This is a subtle but important ops detail: it supports scaling deployments by updating only the back end mapping, while still capturing data from newly installed nodes. (GitHub)
5) Radxa ingestion + storage + dashboards (designed like an ops system)
The Radxa cluster is described as the central authority for:
- ingestion and message timestamping
- identity resolution (MAC → rack)
- long-term storage and alerting (GitHub)
Storage requirements are spelled out in operational terms:
- PostgreSQL is required, with TimescaleDB recommended for time-series optimization.
- Data must remain Grafana SQL datasource compatible.
- Environmental telemetry is specified at 5-second resolution with minimum 1-year retention.
- The system anticipates scale by provisioning ~1 TB persistent storage for multi-year retention and growth. (GitHub)
This reads less like a toy demo and more like an “ops spec” that can be implemented incrementally.
6) Novelty and roadmap baked into the requirements
Even though Telemetry v1 excludes relay control and sensor-bus switching, the repo specifies forward-looking architecture requirements:
- Redundant sensor buses (front/back) sharing ESP32 GPIO pins, selected via analog SPDT switches for electrical isolation and avoidance of bus contention, with coordinated behavior during failover. (GitHub)
- Network failover concept from Ethernet (primary) to Wi-Fi (secondary) with bounded switchover time and event reporting. (GitHub)
- That’s a meaningful design signal: the project is not only collecting telemetry, but planning for fault domains (controller, sensor bus, and network path) as separate layers.
Why it matters
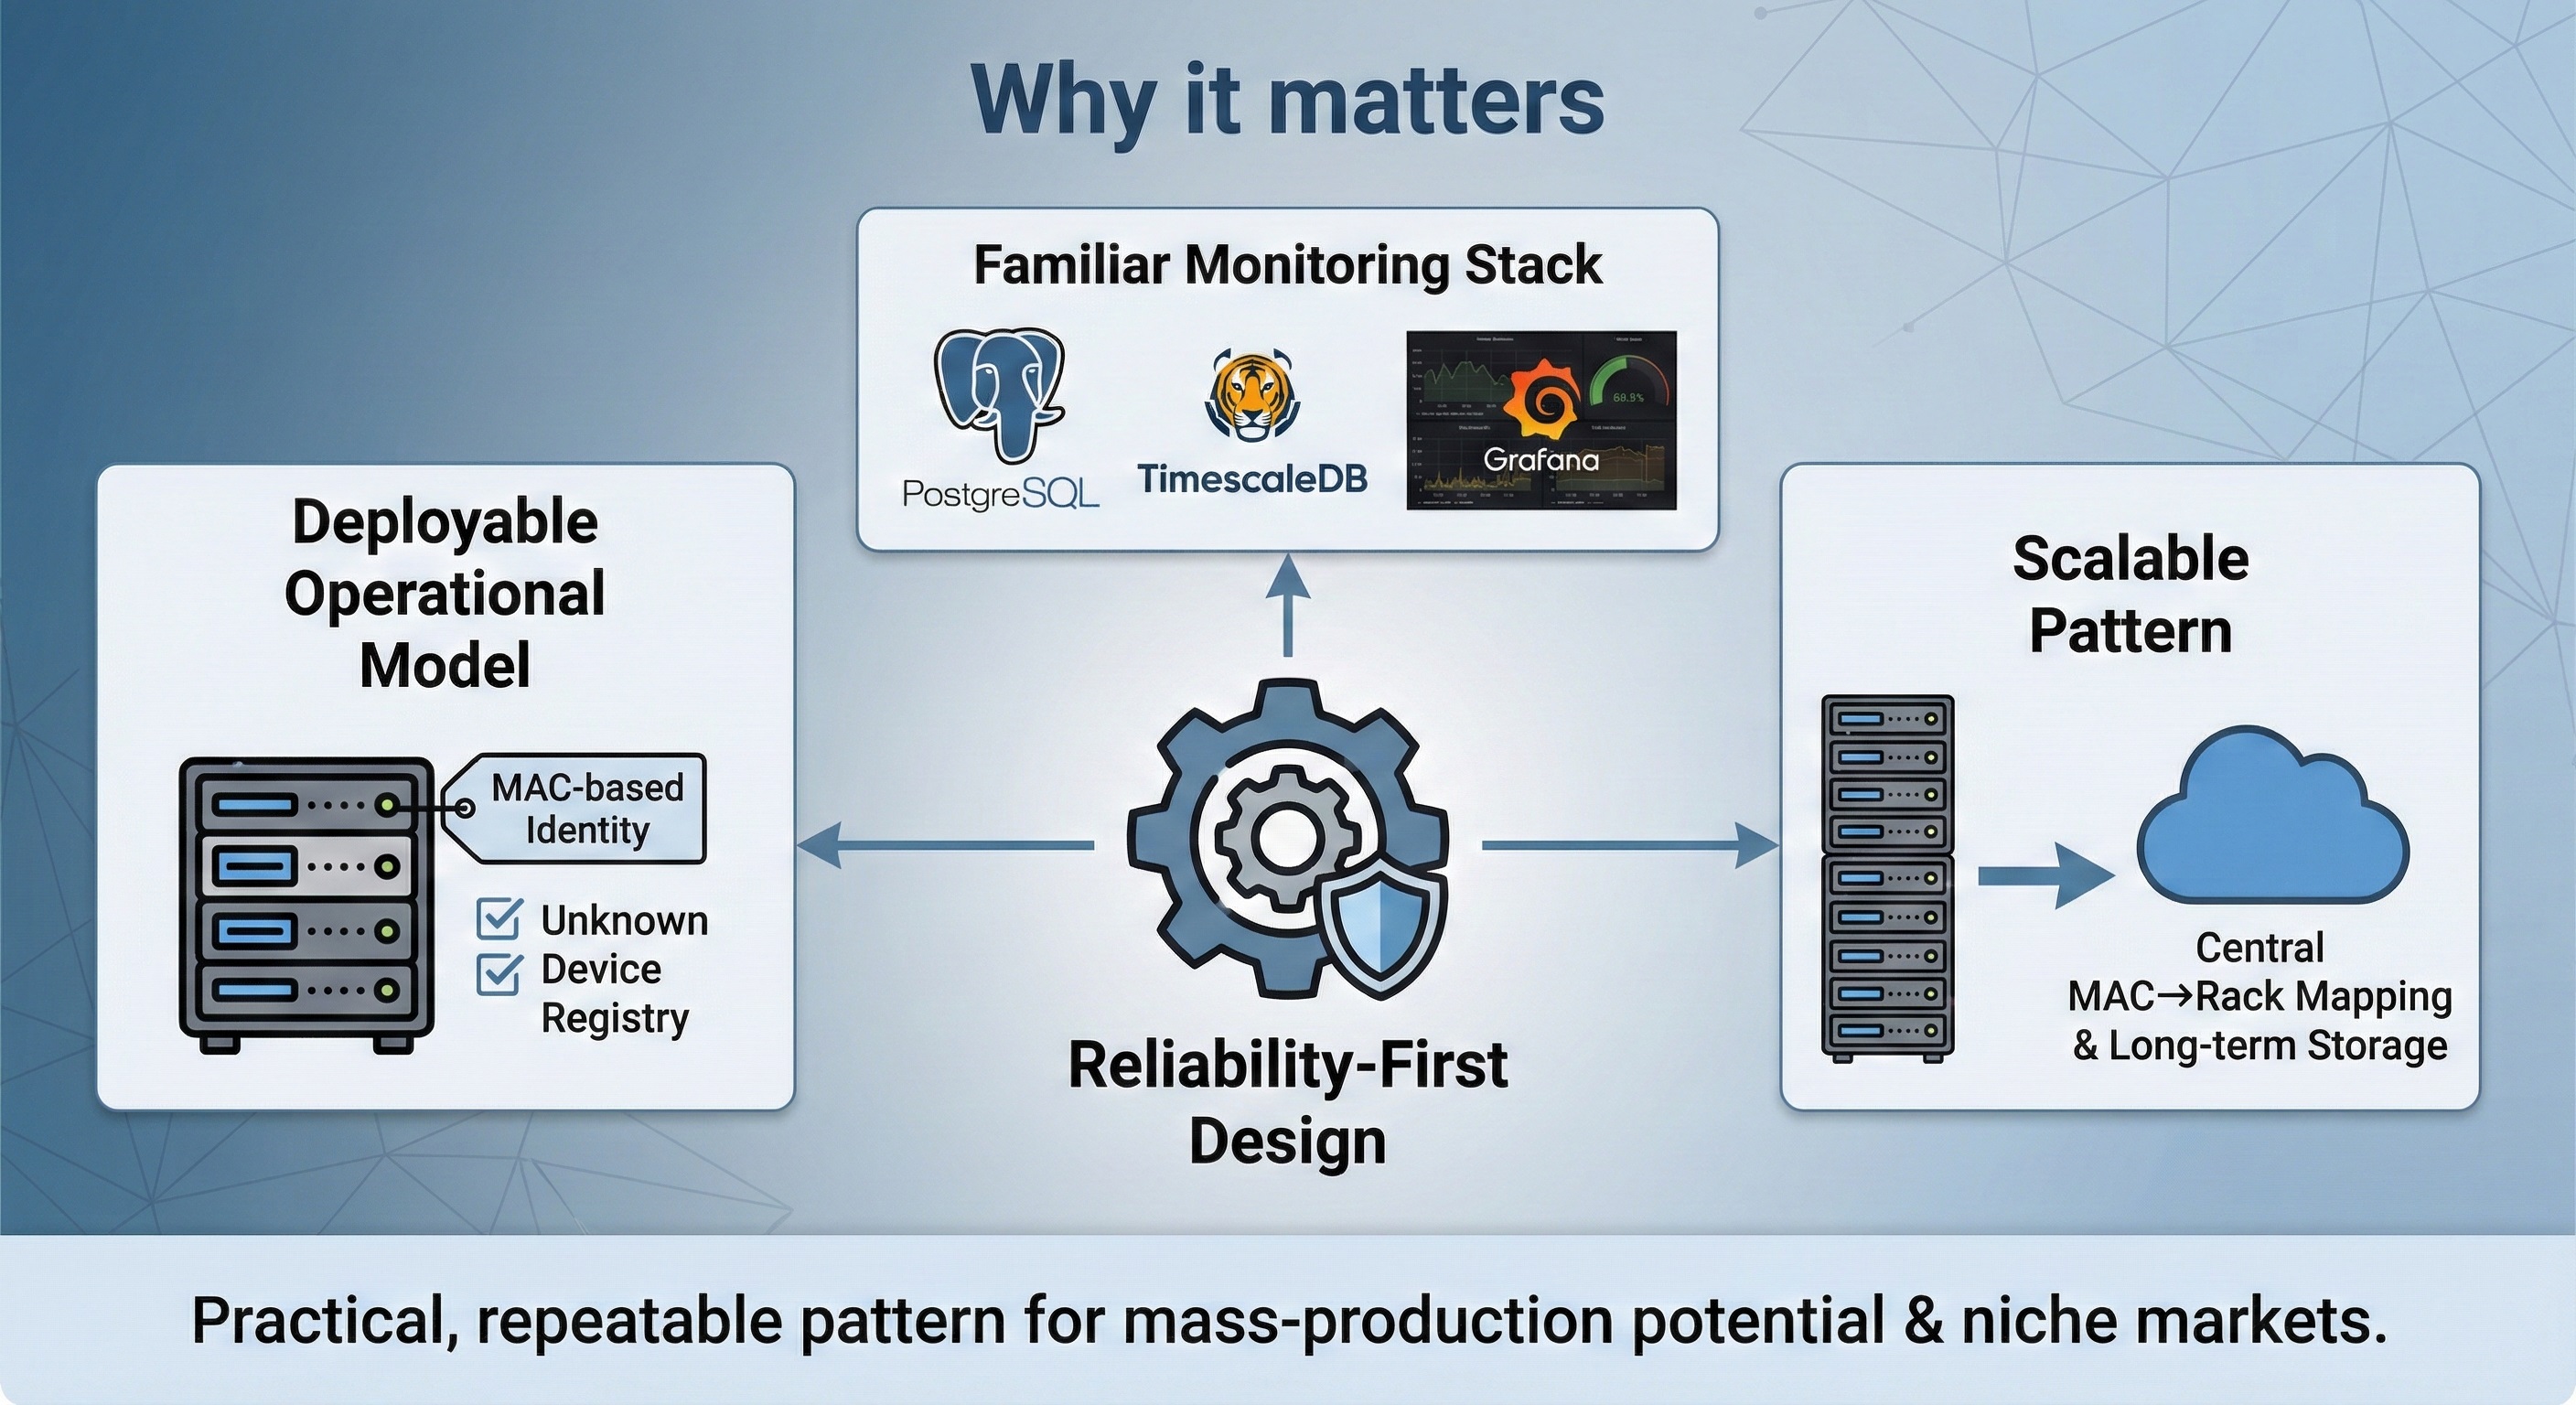
AI-generated image
This repository is useful as a reference not because it claims novel silicon tricks, but because it documents a practical, repeatable pattern:
- A reliability-first edge telemetry node design (active/standby with explicit timings and a “no double-reporting” rule). (GitHub)
- A deployable operational model (MAC-based identity, unknown device registry, daily warning summary, fail-safe ingestion). (GitHub)
- A familiar monitoring marketplace stack (PostgreSQL + optional TimescaleDB + Grafana compatibility) that makes it easy to plug into existing dashboards/alerting workflows. (GitHub)
- WIZnet fit: W5500 is used exactly where it shines—stable wired UDP telemetry—while leaving the MCU to run the failover state machine and sensor logic. (GitHub)
Reason: (mass-production potential) the “rack telemetry node” pattern scales cleanly with central MAC→rack mapping and long-term storage assumptions. (niche market) homelabs, edge clusters, and small rack deployments that value wired reliability and simple ingestion. (GitHub)
Quick notes (reproducibility, missing artifacts, and access)
- The README provides unusually detailed requirement-style documentation (heartbeat timing, schema, storage, retention, and alerting). (GitHub)
- The repo shows an
ESP32-Firmware/directory and a connection guide file, but GitHub pages for those files did not load in this browsing session (GitHub returned an error message), so this curation cannot verify the exact firmware implementation details (e.g., the specific W5500 driver/library usage, link-status detection, or UDP send loop). (GitHub) - No schematic/BOM or demo video is visible from the accessible README sections. If the goal is fast replication by others, adding (1) a wiring diagram or module BOM, and (2) a short “failover demo” clip showing A→B takeover in Grafana, would materially improve reproducibility and reviewer confidence. (GitHub)
Q: What is the REPACSS Telemetry v1 project?
A: REPACSS (Reliable Remote Management) is a high-availability rack telemetry system designed to monitor server rack health. It uses a dual-controller architecture (two ESP32 nodes) to ensure data reporting continues even if the primary controller fails. The system transmits data over wired Ethernet using WIZnet W5500 modules to a central Radxa cluster.
Q: Who created the REPACSS telemetry project?
A: The project is published as an open-source repository on GitHub by TalkingJupiter. It is currently in an active iteration phase, focusing on reliable edge telemetry patterns.
Q: What is the main purpose of this telemetry system?
A: Its primary purpose is to act as a "health report" for server racks. It continuously collects and transmits:
Liveness: Heartbeat signals to prove the rack is online.
Sensor Readings: Environmental data like temperature and humidity.
Operational Events: Critical alerts such as network changes or failover events (switching from Primary to Standby).
References
https://github.com/TalkingJupiter/Reliable_Remote_Management_REPACSS
https://wiznet.io/products/ethernet-chips/w5500
https://www.ibm.com/think/topics/telemetry