
Power Optical Fiber Online Monitoring and Fault Early Warning System [CN121485799A]
Layered system that monitors power-network optical fibers, detects anomalies, estimates fault distance, and maps results to GIS for faster response.
Overview
This patent describes an online monitoring system for optical fibers used in power communication networks. It is built as a layered stack: hardware collects optical power and reflected-light data, software processes and fuses features to identify and predict faults, and an application layer performs fault localization and early warning while presenting results through GIS and a PC-based interface. The design aims to catch small degradations and partial faults earlier than manual or periodic checks, while also reducing the time spent narrowing down physical fault locations.
Main Content
At the edge, the system measures two kinds of signals: optical power levels and OTDR-style reflected light traces. Those streams are cleaned and repaired (noise reduction, interpolation for missing points, outlier correction), then converted into fault-sensitive features such as intensity change rate and spectral characteristics. Multiple sources are combined through weighted fusion to avoid relying on a single fragile indicator.
Fault identification and prediction are positioned as data-processing responsibilities rather than being hardwired into the acquisition unit. The patent outlines a pipeline that includes wavelet-based processing to emphasize fault signatures and clustering-style classification (using Euclidean distance to cluster centers) to separate operating states. Early warning is produced by comparing monitored parameters to thresholds and by estimating a failure probability from historical samples.
Localization uses OTDR distance computation to estimate how far the event is from the measurement end. The result is then integrated with GIS: distance and optical-domain estimates are converted into geographic position so crews can see a map-level fault point rather than just “somewhere along the fiber.”
System Context
This system sits beside the power grid’s communications infrastructure rather than replacing it. The optical fiber remains the communication carrier; this system’s job is to observe its health, detect degradation, and guide maintenance actions. In a utility setting, its value is operational: reduce undetected slow failures, shorten mean time to locate, and standardize response based on consistent data products (alerts, location estimates, map overlays).
Architecture / Design Considerations
A layered architecture is used to isolate fast-changing analytics from stable acquisition hardware. That separation matters because fault-recognition logic will evolve with data, while field hardware tends to be deployed long-term.
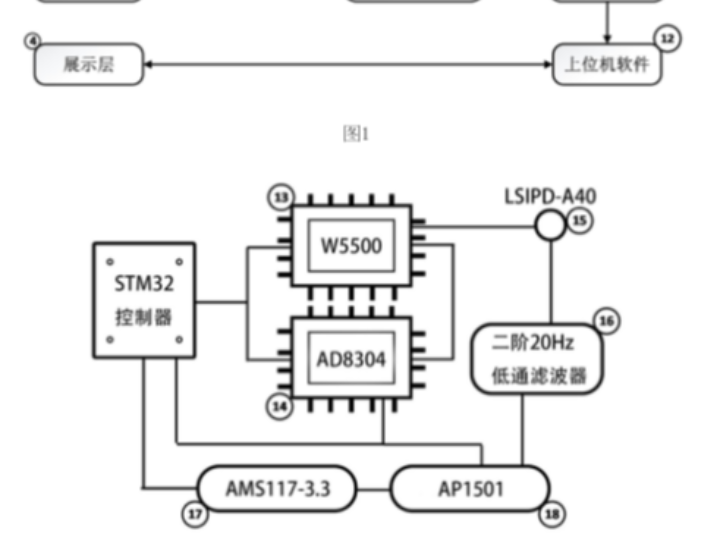
The design explicitly uses an STM32-based acquisition controller connected to optical measurement modules and a network module. Ethernet connectivity is implemented via a WIZnet W5500 module over SPI, which offloads TCP/IP and simplifies reliable remote data transport in environments where robustness is favored over complex host stacks.
High-cost failure points cluster around two areas: (1) data quality at acquisition (bad optical traces or drifting power measurements lead to incorrect downstream conclusions), and (2) localization accuracy (wrong distance-to-fault combined with GIS mapping can dispatch crews to the wrong segment, wasting time during outages or imminent failures). False negatives are especially expensive because they preserve the illusion of health while the fiber continues to degrade.
The system is best treated as an auxiliary system because it does not carry operational control traffic itself; it supports maintenance and reliability decisions. Over-trusting it as a primary truth source would be risky, especially when thresholds, historical sample quality, or GIS asset mapping are incomplete.
Possible Implications
If implemented well, the approach can shift maintenance from reactive “after it breaks” dispatch to earlier intervention when loss trends or reflected-trace signatures indicate emerging damage. It can also standardize fault reporting across different regions by producing comparable outputs (alert types, probabilities, distance estimates, map points).
However, the same automation can create operational risk if alarms are noisy, if model updates are poorly controlled, or if GIS asset data is stale. In practice, the system’s impact depends heavily on calibration, labeled historical fault data, and disciplined mapping between fiber inventory and real geography.
Conclusion
The patent’s core idea is a practical stack: continuous optical sensing plus signal processing plus GIS mapping to make fiber faults both detectable and actionable. The most consequential design choice is treating analytics as a processing-layer function while keeping acquisition stable, and then turning OTDR distance into GIS-visible location to reduce human search time. Removing key modules changes the system’s character: without OTDR it becomes trend monitoring without true distance localization; without GIS it becomes a diagnostic tool that still requires manual field correlation; without Ethernet transport (W5500) it becomes a local instrument rather than an operational network service.
전체 개요
본 특허는 전력 통신망에서 사용되는 광섬유의 상태를 상시로 관찰하고, 이상 징후를 감지해 고장 가능성을 사전에 경고하며, 고장 지점을 거리 추정과 GIS 매핑으로 시각화하는 시스템을 다룹니다. 하드웨어 계층에서 광 파워 및 반사광 데이터를 수집하고, 데이터 처리 계층에서 전처리와 특징 추출 및 융합 분석을 수행한 뒤, 응용 계층에서 고장 위치 산정과 조기 경보를 생성하고, 최종적으로 PC 소프트웨어에서 상태와 경보를 표시하는 흐름으로 구성됩니다.
배경과 목적
전력 시스템에서 통신 광케이블은 설비 운영에 필요한 정보 전달의 기반이기 때문에, 광섬유의 작은 열화나 부분 손상이 누적되면 큰 운영 리스크로 이어질 수 있습니다. 기존의 점검 방식은 미세 손실이나 불완전 단선 같은 초기 징후를 놓치기 쉽고, 현장 조건에 따라 측정 품질이 흔들릴 수 있다는 한계가 있을 수 있습니다. 이 특허의 목적은 광섬유의 상태를 더 자주, 더 일관된 방식으로 파악하고, 이상을 조기에 포착해 대응 시간을 줄이는 데에 있는 것으로 보입니다.
기술 흐름 설명 (신호/데이터/동작 순서 중심)
데이터 수집 단계에서는 광섬유의 광 파워와 OTDR 기반의 반사광 데이터를 여러 채널로 확보합니다.
전처리 단계에서는 슬라이딩 평균 같은 방식으로 잡음을 줄이고, 누락 구간은 보간으로 메우며, 이상치로 판단되는 값은 통계 기반으로 보정해 데이터 품질을 안정화합니다.
특징 추출 단계에서는 광 파워 변화율, 주파수 영역 특성 등 상태 변화를 반영하는 지표들을 뽑아냅니다.
멀티 소스 융합 단계에서는 서로 다른 출처의 특징을 가중치 기반으로 결합해 단일 신호에 과의존하지 않게 만듭니다.
신호 강조 및 분류 단계에서는 웨이블릿 변환 계열 처리로 고장 징후를 두드러지게 만든 뒤, 군집 기반의 분류 논리로 상태를 구분하여 고장 식별과 예측을 수행합니다.
고장 위치 산정 단계에서는 OTDR 거리 계산으로 측정 단말로부터의 고장 거리 값을 산출합니다.
지도 연계 단계에서는 산출된 거리 정보를 GIS 자산 정보와 결합해 지리 좌표 상의 위치로 시각화합니다.
표시 및 운영 단계에서는 상위 소프트웨어가 상태, 경보, 위치 결과를 운영자가 이해하기 쉬운 형태로 제공합니다.
왜 이런 구조가 나왔는지에 대한 해설
현장 장비는 장기간 설치되는 경우가 많아 하드웨어 구성이 자주 바뀌기 어렵고, 반대로 고장 판별 로직은 데이터가 쌓일수록 개선 요구가 생기기 쉽습니다. 따라서 수집 계층과 처리 계층을 분리하면, 센싱과 통신 안정성은 유지하면서도 분석 알고리즘을 발전시키는 방향이 가능해집니다. 또한 OTDR의 거리 정보는 “문제가 있다”를 넘어 “어디가 문제일 가능성이 높은가”로 바로 연결되기 때문에, GIS 연계는 출동 시간과 탐색 비용을 줄이는 쪽으로 설계가 밀렸을 가능성이 있습니다.
생소한 개념에 대한 풀어쓴 설명
OTDR은 광섬유에 짧은 빛 펄스를 넣고, 되돌아오는 반사 신호를 시간에 따라 측정해 “어느 지점에서 변화가 있었는지”를 거리로 환산하는 방식으로 이해하시면 됩니다.
웨이블릿 변환은 신호를 여러 스케일로 나누어 관찰해서, 잡음과 고장 징후를 분리해 보려는 분석 도구로 볼 수 있습니다.
특징 융합은 서로 다른 관측값을 한 번에 판단에 쓰기 위해 묶는 과정이며, 가중치는 각 관측값을 얼마나 믿을지에 대한 비중으로 해석될 여지가 있습니다.
군집 기반 분류는 “비슷한 패턴끼리 묶었을 때 어디 그룹에 가까운가”로 상태를 나누는 방식으로, 라벨 데이터가 제한적인 환경에서 쓰이기 쉽습니다.
시스템 구성 및 선택지 해석
수집 계층은 STM32 계열 MCU와 광 파워 계측 회로, OTDR 계측 모듈, 광 경로 제어, 네트워크 통신, 전원부로 구성되는 것으로 제시됩니다. 통신은 SPI로 연결되는 WIZnet W5500을 이용한 Ethernet 방식이 언급되며, TCP/IP 처리를 하드웨어 쪽에서 상당 부분 담당해 MCU 소프트웨어 부담을 줄이고 전송 안정성을 확보하려는 선택으로 해석될 수 있습니다.
전원은 AC 220V 및 DC 48V 입력을 지원하고, DC 24V에서 BUCK 및 LDO로 각 모듈에 필요한 전압을 만드는 구성이 언급됩니다. 이는 변전소나 통신 설비 환경에서 전원 형태가 다를 수 있다는 전제에 대응하려는 의도가 있을 수 있습니다.
내부 관점에서의 시사점
이 시스템의 핵심 차이는 “단순 감시”가 아니라 “거리 기반 위치 산정과 GIS 결합으로 조치 가능성이 높은 결과물”을 만든다는 점에 있습니다. 즉, 알람을 내는 것에서 끝나지 않고 출동 결정을 돕는 방향으로 설계가 정렬되어 있습니다.
실패 비용이 가장 큰 구간은 고장 위치 산정과 조기 경보의 품질로 보입니다. 위치가 틀리면 출동이 빗나가고 복구 시간이 늘어날 수 있으며, 경보가 과도하면 운영자가 무시하게 되고, 경보가 부족하면 중요한 열화를 놓칠 수 있습니다.
보조 수단으로서의 위치는 명확합니다. 이 시스템은 전력 통신을 “대신”하지 않고, 광섬유라는 통신 매체의 상태를 관찰하여 유지보수와 운영 의사결정을 돕는 역할에 가깝습니다.
특정 구성요소를 제거하면 시스템 성격이 바뀝니다. OTDR이 빠지면 거리 기반 위치 산정이 약해져 추세 감시 중심으로 축소될 수 있고, GIS가 빠지면 결과 해석과 현장 매칭이 수작업에 의존하게 되어 운영 효율이 떨어질 수 있습니다. Ethernet 전송이 약해지면 현장 단말에 국한된 계측 장비 성격이 강해질 가능성이 있습니다.
FAQ
기존 점검 방식 대비 가장 큰 차별 지점은 무엇인가요?
고장 여부 판단을 넘어, OTDR 거리 추정과 GIS 결합으로 “조치 가능한 위치 정보”까지 이어지는 구성이 핵심 차이로 보입니다. 다만 실제 차별 효과는 현장 데이터 품질과 자산 정보 정확도에 따라 달라질 수 있습니다.
왜 계층형 구조로 나누었을 가능성이 있나요?
현장 수집부는 안정성과 장기 운용이 중요하고, 고장 판별 로직은 개선 여지가 크기 때문에 분리하는 편이 운영에 유리할 수 있습니다. 또한 기능 경계를 나누면 장애 원인 분리가 쉬워질 가능성이 있습니다.
이 시스템에서 핵심 신호 흐름은 어떻게 잡히나요?
광 파워와 반사광 데이터를 수집한 뒤, 전처리와 특징 추출 및 융합을 거쳐 고장 식별과 예측을 수행하고, OTDR 기반 거리 산정 결과를 GIS에 연결해 화면에 표시하는 흐름으로 정리될 수 있습니다.
실패 비용이 가장 큰 판단 지점은 어디로 보이나요?
고장 위치 산정의 정확도와 조기 경보의 신뢰도가 가장 큰 비용 구간일 가능성이 있습니다. 위치가 빗나가면 출동 비용과 복구 시간이 증가할 수 있고, 경보 품질이 나쁘면 운영 의사결정이 왜곡될 수 있습니다.
왜 보조 수단으로 보는 것이 타당한가요?
이 시스템은 전력 통신 트래픽을 운반하는 주 경로가 아니라, 그 경로의 건강 상태를 관찰해 유지보수와 대응을 돕는 역할로 보입니다. 따라서 운영 체계에서는 감시 및 의사결정 지원 장치로 자리 잡기 쉬울 수 있습니다.
저자 정보
徐世鹏, 温治超, 王勇, 荆赫君, 宋琳, 孙雷, 李明泽, 姚欣欣, 刘素华, 韩冬阳
소속은 전력 공급 관련 조직으로 보이며, 전력 통신 인프라의 운영 환경을 전제로 한 공학적 배경을 가졌을 가능성이 있습니다. 공개된 정보가 제한적임