
Research on Data Operation Monitoring and Analysis System of Computer Intelligent Cloud Platform
This paper proposes an application anomaly detection and bottleneck identification system (AAD-PSC) based on cloud platform service components.
Cloud platforms make it easy to deploy applications at scale, but most built-in monitoring only reads the OS process table — too coarse to catch anomalies as they happen, and too rigid to tune per application. This project, published as an IEEE conference paper by engineers at State Grid Fujian Electric Power, builds a hardware-to-cloud monitoring pipeline where a W5500-based embedded Ethernet interface carries sensor data over UDP/IP, and a dynamic-sampling algorithm concentrates measurements exactly where resource usage fluctuates.
COMPONENTS
Hardware components
- WIZnet W5500 hardwired TCP/IP Ethernet controller (embedded Ethernet interface, paired with an MCU)
- NLE-PE9000 IoT data acquisition gateway (S3C2451 embedded ARM processor)
- Zigbee coordinator + Zigbee sensor nodes (temperature/humidity, flame, combustible gas, 4-channel analog collector)
- ADAM-4150 digital I/O module (7 DI / 8 DO, Modbus over 2-wire RS-485)
- HC-SR04 ultrasonic ranging sensor (2–400 cm, ±3 mm)
- BMP180 barometric pressure sensor (I2C, 3.3 V, Bosch)
- Raspberry Pi (barometric sensor host)
- Wi-Fi module, CAN bus, RS-485, RJ45 Ethernet interfaces on the gateway
Software & Tools
- UDP/IP protocol for local ↔ cloud data exchange
- OneNet IoT cloud platform (device registration, data-stream nodes, browser/PC access)
- Open-source Modbus protocol (wired sensor network)
- Docker 1.9.1 container engine on Ubuntu 14.04 (4-core CPU, 8 GB storage test platform)
- Linux
/procvirtual filesystem +stracefor resource and system-call collection
Source notice — This article is a technical reconstruction of the IEEE conference paper "Research on Data Operation Monitoring and Analysis System of Computer Intelligent Cloud Platform" by Lin Dewei, Jiang Meiling, Zhang Helin, Xu Yiming (State Grid Fujian Electric Power Co., Ltd.) and Yan An (State Grid Info-Telecom Great Power Science and Technology Co., Ltd.), presented at the 2023 IEEE 3rd International Conference on Data Science and Computer Application (ICDSCA), Dalian, China, DOI: 10.1109/ICDSCA59871.2023.10392417. It is not a translation; the content has been reorganized around the role of the W5500 Ethernet interface, the gateway architecture, and the adaptive sampling algorithm, from the perspective of an embedded networking editor at maker.wiznet.io.
Author / Source Credibility
Reconstructed by: Bruno (maker.wiznet.io editor, WIZnet)
Original authors:
- Lin Dewei, Jiang Meiling, Zhang Helin, Xu Yiming — Information and Communication Branch of State Grid Fujian Electric Power Co., Ltd., Fuzhou, China. State Grid is China's national electric utility; the Fujian ICT branch operates provincial-scale monitoring and communication infrastructure, which is consistent with the paper's focus on cloud-platform operation monitoring.
- Yan An — State Grid Info-Telecom Great Power Science and Technology Co., Ltd., Fuzhou, China (a State Grid ICT subsidiary).
- The paper itself is verifiable through IEEE Xplore (peer-reviewed conference proceedings, ©2023 IEEE).
Editorial note on the source: The paper is an academic system-description paper rather than an open-source build log. Several figures are explicitly credited to unrelated third-party papers (e.g., the "air pressure module circuit" figure is cited from an HMD tactile-mechanism paper), and no firmware repository is published. — the reconstruction below is limited to what the text of the paper states.
New Content Summary
| Item | Detail |
|---|---|
| Project type | Cloud platform application anomaly detection & bottleneck identification system (AAD-PSC) with an IoT data-acquisition front end |
| WIZnet chip | W5500 — hardwired TCP/IP Ethernet controller forming the embedded Ethernet interface together with the MCU |
| Protocols | UDP/IP (device ↔ cloud), Modbus over RS-485 (wired sensors), Zigbee (wireless sensors), I2C (BMP180) |
| Platform | OneNet IoT cloud platform; Docker/Ubuntu container test environment |
| Core value | A three-layer "cloud server – device – sensor/controller" architecture where sampling frequency adapts exponentially to resource fluctuation, cutting monitoring overhead while catching anomalies within ~5 minutes |
Similar Existing Content
1. How Does STM32F103 Use W5500 for Custom MQTT and OneNET IoT?
- Why similar: Same chip (W5500) and same cloud platform (OneNET), same application pattern (sensor telemetry uplink from an MCU).
- How it differs: Uses MQTT over TCP with FreeRTOS tasks; this paper uses lightweight UDP/IP and focuses on the server-side monitoring algorithm rather than the transport stack.
- Connection point: The MQTT article is a natural "transport upgrade" reference for readers who want QoS guarantees that raw UDP does not provide.
2. How Does W5500 Communicate with OneNET Cloud Using HTTP?
- Why similar: Same chip + same platform (W5500 → OneNET), same embedded uplink problem.
- How it differs: HTTP request/response polling vs. this project's continuous UDP streaming with server-side dynamic sampling; no anomaly-detection layer.
- Connection point: Together with this article, it completes a three-protocol comparison (HTTP / MQTT / UDP) for W5500-to-OneNET designs.
3. lightyear_hub – A Multi-Protocol IoT Sensor Gateway Powered by W5500 Ethernet
- Why similar: Same chip (W5500) and same architecture role — a gateway aggregating Zigbee/BLE sensor traffic and forwarding it to the cloud over wired Ethernet.
- How it differs: lightyear_hub is a maker-grade open build; this paper is a utility-grade system with a formal anomaly-detection algorithm and quantitative overhead evaluation.
- Connection point: lightyear_hub could adopt this paper's dynamic sampling-interval formula almost directly to reduce its own uplink and storage load.
Differences and Extension Value
Most W5500 + cloud articles on the Maker site answer "how do I get sensor data to the cloud?" This paper answers the next question: "once data is flowing, how do I monitor it without the monitoring itself becoming the bottleneck?" Its distinctive contributions are (1) a mathematically defined adaptive sampling interval driven by resource fluctuation amplitude, and (2) quantified monitoring overhead — something hobbyist builds almost never measure.
Extension paths: the dynamic-interval formula is platform-agnostic and could be ported into any W5500/W55RP20 firmware loop that reports telemetry (energy monitors, Modbus gateways, DAQ nodes). Conversely, this system's aging software stack (Docker 1.9.1, Ubuntu 14.04, UDP without delivery guarantees) can be modernized using patterns already documented on the Maker site — MQTT QoS transport, TLS, and current container runtimes.
PROJECT DESCRIPTION
How do you monitor applications on a cloud platform closely enough to catch anomalies within minutes — without the monitoring itself consuming the very CPU and bandwidth you are trying to protect?
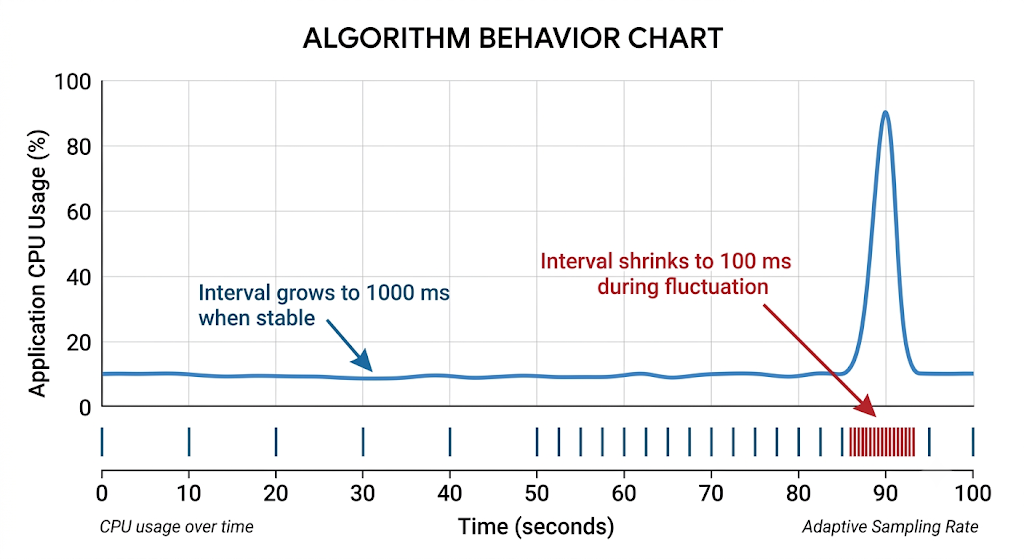
이 프로젝트의 답은... make the sampling rate a function of the signal itself. When CPU/memory usage is stable, sample slowly (up to 1,000 ms intervals); when it fluctuates, shrink the interval exponentially (down to 100 ms). Move raw data off the device early — through a W5500 hardwired Ethernet interface over UDP — and do all heavy analysis in the cloud, where compute is cheap.
0. Core Technology: the W5500 Embedded Ethernet Interface
The device-side network interface is a two-chip design: a general-purpose MCU plus the WIZnet W5500 Ethernet controller. The paper states this plainly — "the embedded Ethernet interface is composed of MCU and Ethernet control chip W5500" — and the choice matters for the system's stated goals of low cost, small size, low power consumption and high data transmission accuracy. Because the W5500 runs the TCP/IP (and UDP/IP) stack in hardware, the MCU never spends cycles on checksum computation, retransmission timers, or packet reassembly. In a monitoring system, that is not just an efficiency win — it is a measurement-integrity win: the network stack cannot perturb the very CPU-usage signal the system is trying to observe. A software LwIP stack on the same MCU would inject its own CPU jitter into the data.
The specific MCU model paired with the W5500 is not named in the paper [확인 필요].
1. Development Platform: the IoT Gateway and OneNet Cloud
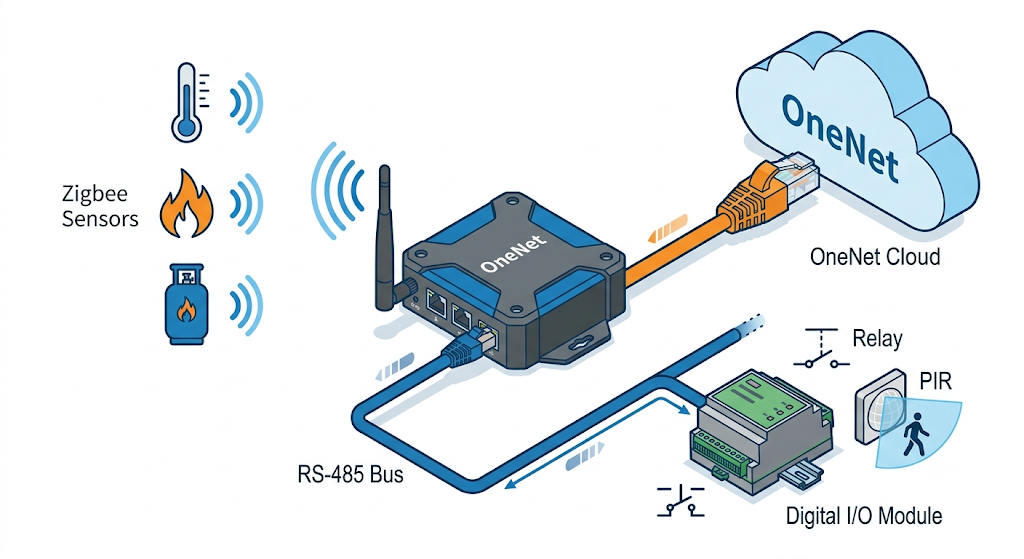
The aggregation point is an NLE-PE9000 IoT data-acquisition gateway built around an S3C2451 embedded ARM processor. It bridges two sensor networks: a wireless one (Zigbee coordinator with temperature/humidity, flame, and combustible-gas nodes plus a 4-channel analog collector) and a wired one (an ADAM-4150 digital I/O module — 7 inputs, 8 outputs — speaking open-source Modbus over 2-wire RS-485). The gateway also carries Wi-Fi, CAN, RS-485, and RJ45 interfaces.
On the cloud side, OneNet provides device registration, per-device data-stream nodes, and browser/PC access with a command downlink — users can both watch live data and issue control instructions back to field actuators. The paper highlights that this configure-not-code approach "can greatly reduce costs."
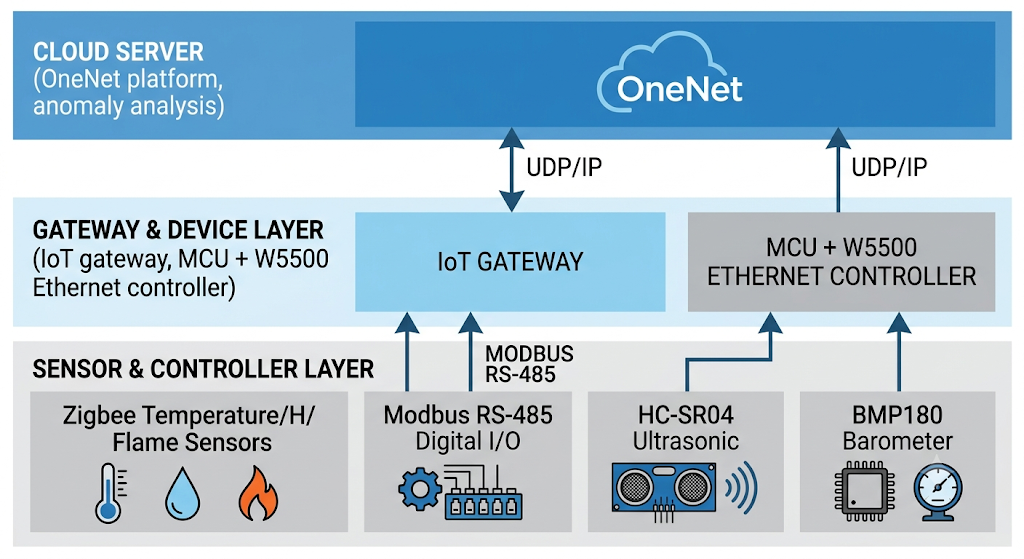
2. Operating Principle: Four Domains, One UDP Pipe
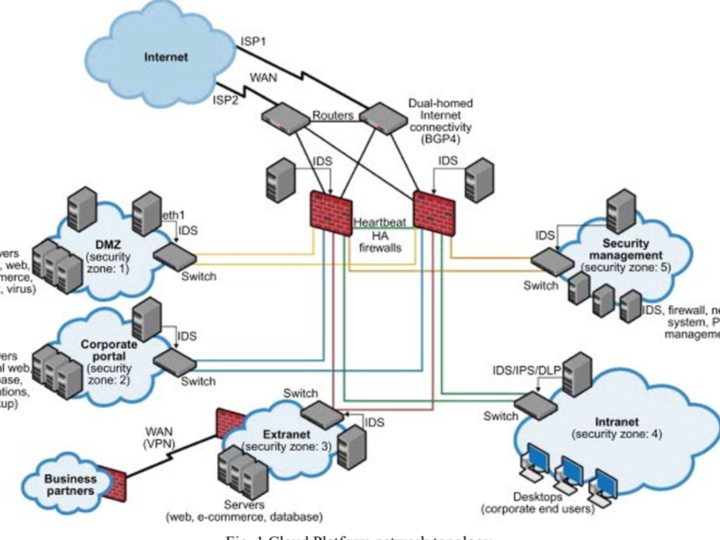
Data flows through four domains — hardware equipment → gateway → cloud platform → application — with UDP/IP as the local-to-cloud transport. Sensors and actuators (RS-232/RS-485/wired/Wi-Fi) feed the intelligent gateway; the gateway parses multi-protocol traffic, applies local decision logic, stores data in a database, and forwards it upward. The cloud layer is organized into communication, storage, management, and application-service subsystems (data analytics, application interfaces, data query, location services). PC clients consume everything through the cloud platform's API rather than talking to devices directly.
Choosing UDP over TCP is a deliberate trade: minimal per-packet overhead and no connection-state cost on constrained devices, accepted because the cloud-side analysis is statistical — a single lost sample does not break an anomaly-detection window. (For control downlinks where delivery matters, this is a real limitation — see Room for Improvement.)
3. Device A: Ultrasonic Ranging Node (HC-SR04)
Distance sensing uses the HC-SR04 non-contact ultrasonic module: 2–400 cm effective range, ±3 mm precision. It integrates the ultrasonic transmitter, receiver, and control circuit in one module — the classic trigger-pulse / echo-width measurement pattern. In this system it serves as a representative analog-world input whose readings travel the full sensor → gateway → cloud path.
4. Device B: Barometric Node (BMP180 + Raspberry Pi)
Atmospheric pressure comes from a Bosch BMP180 on the I2C bus, hosted by a Raspberry Pi. The implementation detail worth copying is the calibration flow: the BMP180 outputs uncompensated pressure, and its internal EEPROM stores 176 bits (22 bytes) of factory correction coefficients. Correct firmware must read the EEPROM coefficients first, then apply them to every raw conversion:
init:   read 22 bytes of calibration data from BMP180 EEPROM
loop:   raw_temp  = read_uncompensated_temperature()
        raw_press = read_uncompensated_pressure()
        true_press = compensate(raw_press, raw_temp, calib_coeffs)
        send true_press → gateway → cloud (UDP)
Skipping the EEPROM read is the single most common BMP180 integration bug — you get plausible-looking but systematically wrong values.
5. Core Logic: the Dynamic Sampling-Interval Algorithm
This is the paper's real contribution: sampling frequency that adapts exponentially to resource fluctuation. The monitoring module collects two data types per application — resource usage Resource(t) = [CPU(t), Mem(t)] read from Linux /proc, and system-call traces SysCall(t_l, t_r). Because CPU usage is "compressible" (no meaningful instantaneous value), only interval averages are taken.
The algorithm keeps the last n resource records and computes, for each resource, the max/min ratio:
Q = [ CPU_max/CPU_min ,  Mem_max/Mem_min ]        # each term ≥ 1.0
P = Q × B                                          # B = [α_cpu, α_mem]^T weighting
Interval(t_cur) = X^(-(P-1.0)) × (U - L) + L       # X = e in the tests
Larger fluctuation → larger P → exponentially smaller interval, bounded between L = 100 ms and U = 1,000 ms (the container engine's own static monitor runs at a fixed 500 ms for comparison; fluctuation threshold K = 1.2). The exponential shape means the monitor reacts sharply to genuine jitter but relaxes quickly once the application stabilizes — exactly the behavior you want when the anomaly signature is the jitter.
6. Verification: Exception-Detection Test
Anomaly detection was validated by injecting storage-latency faults and measuring time-to-detection. The team first established a baseline: 10 undisturbed 1-hour runs of a sample program to get its normal response-time mean and standard deviation. They then simulated a slow cloud-storage component using the OS PageCache mechanism — 8 threads writing 4 KB buffers — with a 15 s analysis interval, 30-minute statistics window, and 5-hour program runtime.
Across 10 injected exceptions, detection latency ranged 235 s to 299 s, averaging 268 s (~4.5 minutes). The paper notes detection time is strongly coupled to the analysis-interval setting, so it can be tuned down at the cost of more frequent analysis.
7. Server-Side Results: Overhead Accounting
The dynamic method captures more of what matters while spending less on what doesn't. In an 80–100 s observation window, static sampling took 41 points vs. 56 dynamic (1 : 1.37 overall) — but during the actual CPU spike (89–95 s) the ratio was 1 : 2.0, while in stable periods it fell to 1 : 0.96. When CPU usage was low, dynamic sampling needed only 60.8 % of the static method's samples.
System-call tracing was equally disciplined. Full-program strace on the file-compression workload recorded 1,168,867 calls (160.4 MB) at ~8 % CPU cost — only a 3.03 % program slowdown (262.53 s vs. 254.80 s), but wasteful in data. With the fluctuation-gated collection, tracing covered just 41.78 % of runtime, collected 736,386 records (99.13 MB), and cut excess data by 38.2 % versus whole-process tracing. The test platform was Docker 1.9.1 on Ubuntu 14.04 (4-core CPU, 8 GB storage) running a file-compression service.
Takeaways
- Hardware TCP/IP protects measurement integrity. Offloading the network stack to the W5500 keeps MCU CPU-usage telemetry clean — the transport can't contaminate the signal being monitored.
- Sample the derivative, not the clock. Tying sampling interval to fluctuation amplitude (exponentially) captured 2× more points during anomalies while spending ~40 % fewer samples during calm periods.
- UDP is defensible for statistical telemetry. When analysis is windowed and cloud-side, occasional packet loss is tolerable and the device-side cost savings are real.
- Baseline before you detect. The 10-run normal-response characterization is what makes the 268 s average detection figure meaningful.
- Gate the expensive probes. Even a "cheap" tracer (3 % slowdown) generated 160 MB; fluctuation-gated tracing cut data 38.2 % with no loss of diagnostic coverage during anomalies.
Room for Improvement
- Transport reliability: raw UDP has no delivery guarantee — a problem for the control downlink (actuator commands). An MQTT-over-TCP path via the same W5500, with QoS 1/2 for commands and UDP retained for bulk telemetry, would be a targeted fix.
- Security: the paper describes no authentication or encryption on the UDP link [확인 필요 — 논문에 보안 계층 언급 없음]. For a power-utility context this is significant; TLS on TCP sockets or DTLS would be the modern baseline.
- Software stack age: Docker 1.9.1 / Ubuntu 14.04 are long past end-of-life; results should transfer to current runtimes but re-validation is warranted.
- Reproducibility: no firmware or server code is published, and several figures are cited from unrelated papers, so third-party reproduction requires reimplementation from the algorithm description.
Notes for New Designs
- The interval formula
X^(-(P-1.0)) × (U-L) + Lis three lines of firmware — portable to any W5500/W55MH32/W55RP20 telemetry loop where uplink bandwidth or flash logging is constrained. - Start with the paper's constants (L = 100 ms, U = 1,000 ms, X = e, K = 1.2) and tune B (the per-resource weights) to whichever resource best predicts your failure mode.
- If you replicate the architecture today: keep the three-layer split, but replace OneNet-specific bindings with MQTT so the cloud side is portable, and use the W5500's multiple hardware sockets to run telemetry (UDP) and command/control (TCP) channels concurrently on one chip.