Using Two W5500-EVB-PICO Boards as Debugprobes for the RP2040
Using Two W5500-EVB-PICO Boards as Debugprobes for the RP2040
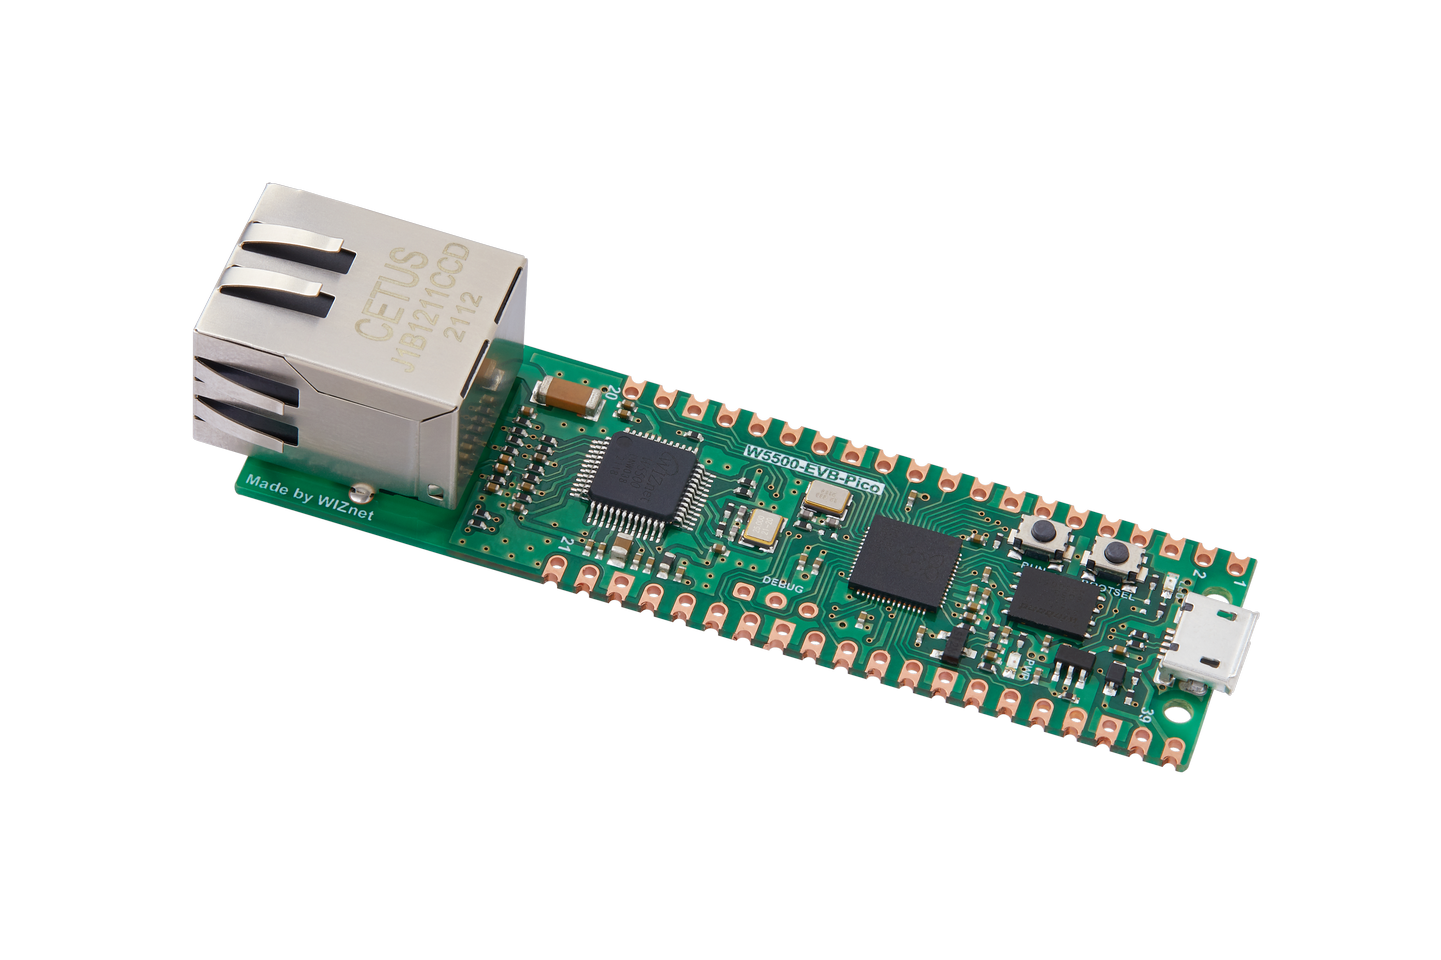
WIZnet - W5500-EVB-Pico
x 2
In this post, I will introduce how to use two W5500-EVB-PICO boards to run the DebugProbe for the Raspberry Pi Pico in VS Code.
The reason for writing this post is that although there are many articles related to DebugProbe, I had to refer to numerous articles to get it running in a Windows environment, and it still didn't work. Despite its simplicity, I encountered too many trial-and-error issues. I am posting this to help other users avoid such difficulties.
There are several reasons to use this DebugProbe. Notably, the cost of J-Link and ST-Link debuggers can be quite burdensome.
Using the W5500-EVB-PICO as a DebugProbe can significantly reduce cost concerns. The Pico itself is easy to obtain at a low cost, and its high compatibility with open-source tools allows for flexible use in various development environments.
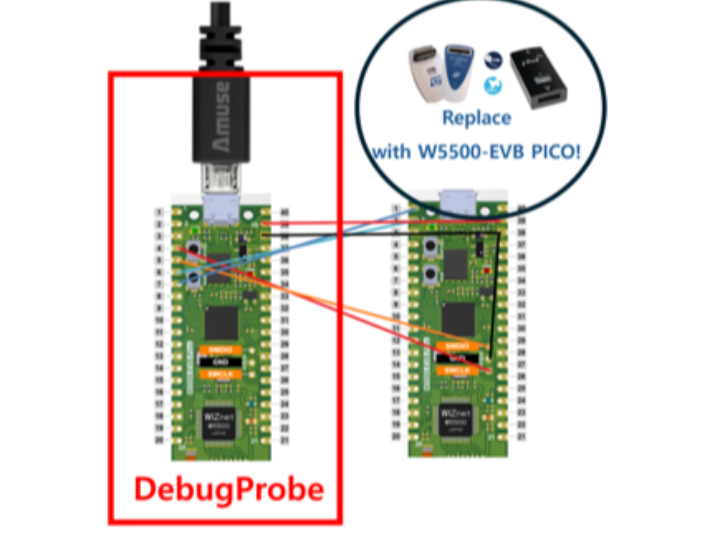
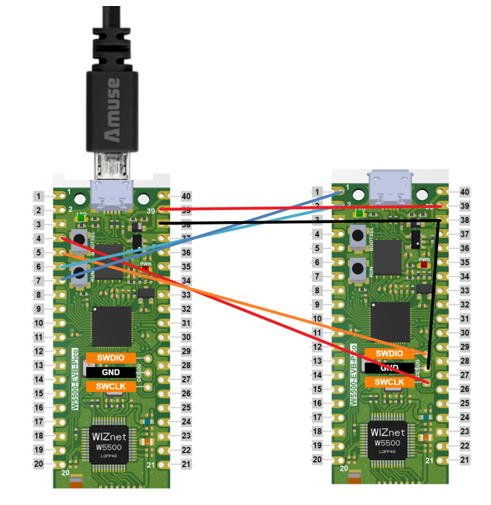
The test scenario for this post is simple. By connecting two PICO boards, we will flash firmware via SWD and then debug the flashed firmware. In this setup, one PICO will act as the debugger, while the other will serve as the Debug Target Board.
Let's delve into the detailed steps to configure this DebugProbe with VS Code.
The steps will be as follows:
- Install OpenOCD SW
- Install the latest version of the ToolChain
- Set the path in the project you want to debug
- Run
By carefully following the steps below, you will be able to use the W5500-EVB-PICO as a DebugProbe with VS Code in a Windows environment.
1. Install OpenOCD
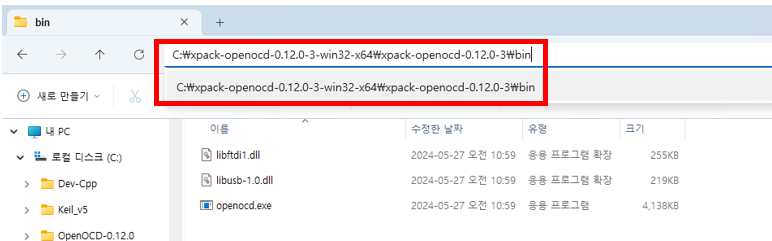
First, download OpenOCD from the link below and extract it to an appropriate location.
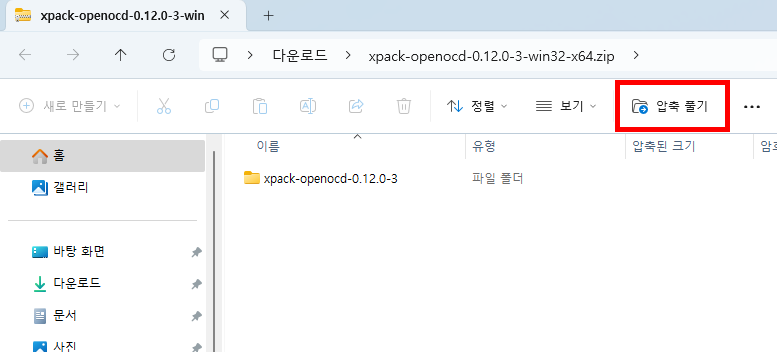
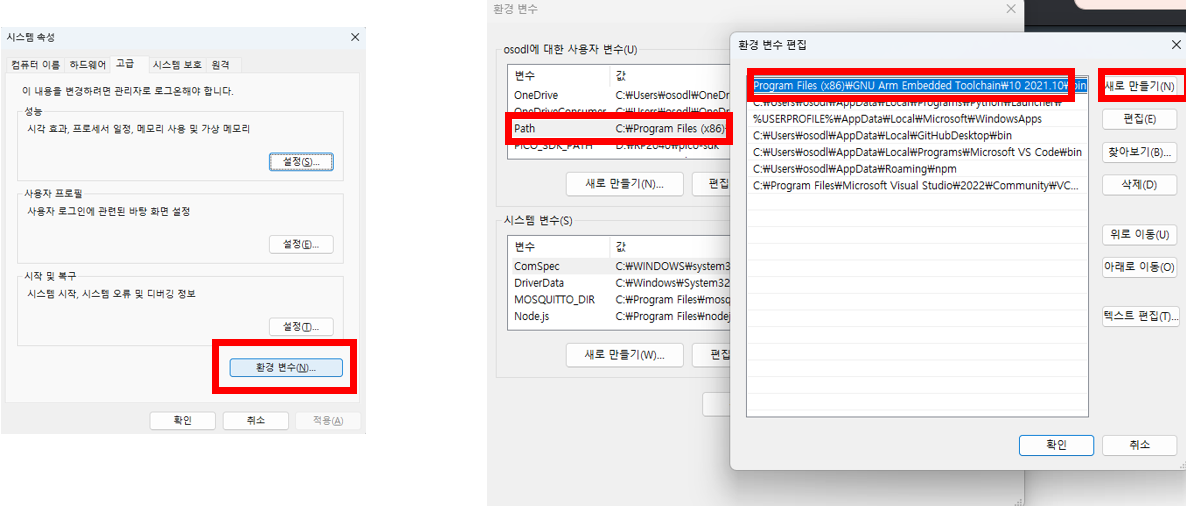
Once you have completed the extraction, refer to the image below to copy the path of the executable file in order to add it to the environment variables.
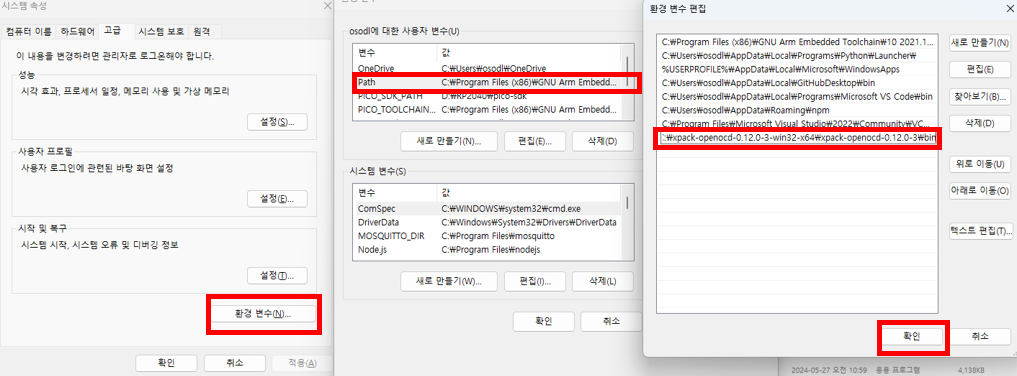
Search for "System Environment Variables" in the Windows search bar and run it, then add the copied path as follows.
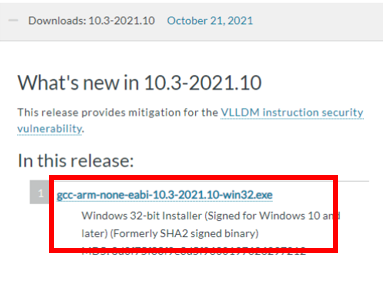
2. Install the latest version of the ToolChain
Next, you need to install the latest version of the ToolChain for the GDB executable file. If the ToolChain version you have is already the latest, you don't need to install it again.
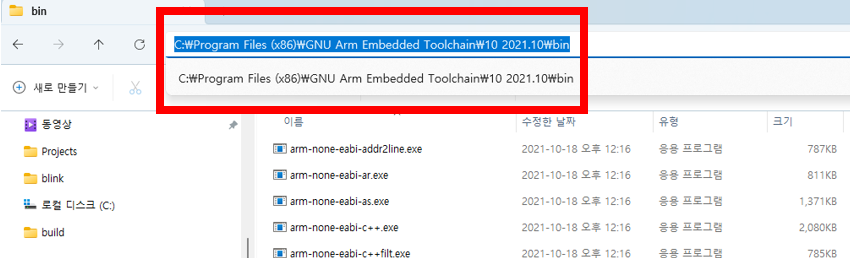
Just like with OpenOCD, copy the ToolChain path and add it to the 'Path' in the System Environment Variables. Although there is an option to add the path to the environment variables at the end of the installation, you might miss it, so it's good to double-check.
Once you have set the paths for OpenOCD and the ToolChain, you need to restart your PC to apply the changes.
3. Set the path in the project you want to debug
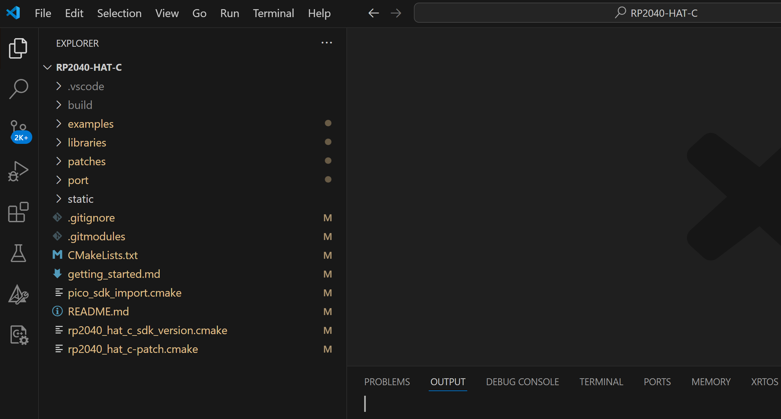
You need to set the path in the project you want to debug. Since WIZnet provides projects and libraries for the W5500-EVB-PICO, I opened the 'RP2040-HAT-C' project to test debugging with the loopback example.
Add the launch.json file and settings.json file by adding the .vscode directory to the project as below.
If you have the settings.json file, you don't need to add it.
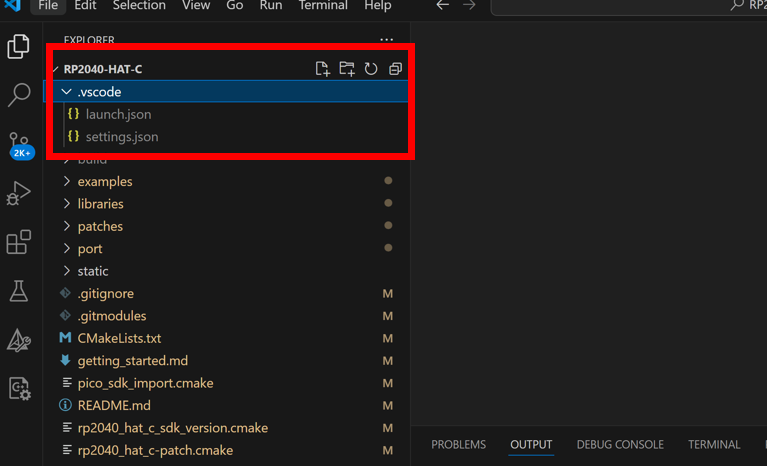
In the project, add a .vscode directory and then add the launch.json and settings.json files as shown below.
If the settings.json file already exists, you do not need to add it again.
{
    "version": "0.2.0",
    "configurations": [
      {
        "name": "Cortex Debug",
        "cwd": "${workspaceRoot}",
        "executable": "D:/Pico/RP2040-HAT-C/build/examples/loopback/w5x00_loopback.elf",
        "request": "launch",
        "type": "cortex-debug",
        "servertype": "openocd",
        "gdbPath": "arm-none-eabi-gdb",
        "openOCDLaunchCommands": ["adapter speed 5000"],
        "device": "RP2040",
        "configFiles": [
          "C:/OpenOCD-0.12.0/share/openocd/scripts/interface/cmsis-dap.cfg",
          "C:/OpenOCD-0.12.0/share/openocd/scripts/target/rp2040.cfg"
          ],
          "searchDir": ["C:/OpenOCD-0.12.0/share/openocd/scripts"],
        "svdFile": "D:/Pico/pico-sdk/src/rp2040/hardware_regs/rp2040.svd",
        "runToEntryPoint": "main",
        // Give restart the same functionality as runToEntryPoint - main
        "postRestartCommands": [
            "break main",
            "continue"
        ]
      }
    ]
  }
Copy and paste the following code into the settings.json file without any modifications:
{
    "cmake.statusbar.advanced": {
        "debug": {
            "visibility": "hidden"
        },
        "launch": {
            "visibility": "hidden"
        },
        //"build": {
        //    "visibility": "hidden"
        //},
        //"buildTarget": {
        //    "visibility": "hidden"
        //}
    },
    "cmake.buildBeforeRun": true,
    "C_Cpp.default.configurationProvider": "ms-vscode.cmake-tools"
}
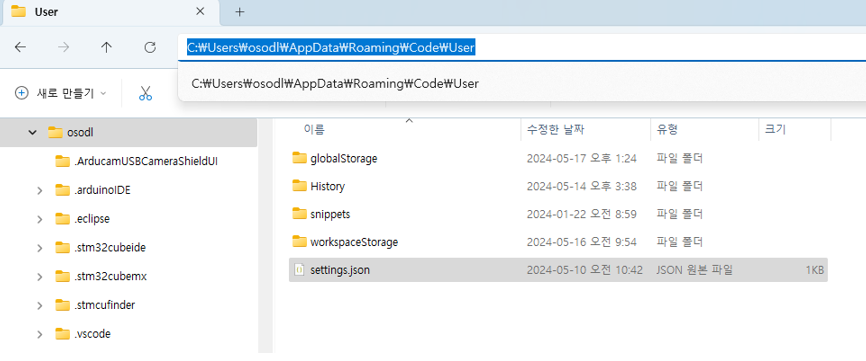
For the final configuration step, go to the path C:\Users\(username)\AppData\Roaming\Code\User and modify the settings.json file there to set the default settings for VS Code. Be careful not to confuse this file with the project-specific settings.json file.
Add the missing parameters to the above code and set the path for cortex-debug.openocdPath to match your own path.
{
    "cmake.generator": "NMake Makefiles",
    "cmake.configureEnvironment": {
        "PICO_SDK_PATH": "D:\\RP2040\\pico-sdk",
        "PICO_TOOLCHAIN_PATH": "C:\\Program Files (x86)\\GNU Arm Embedded Toolchain\\10 2021.10\\bin"
    },
    "cmake.configureOnOpen": true,
    "security.workspace.trust.untrustedFiles": "open",
    "cortex-debug.gdbPath": "arm-none-eabi-gdb",
    "cortex-debug.openocdPath": "C:/OpenOCD-0.12.0/bin/openocd.exe",
}
4. RUN
For execution, physically connect the boards as shown below.
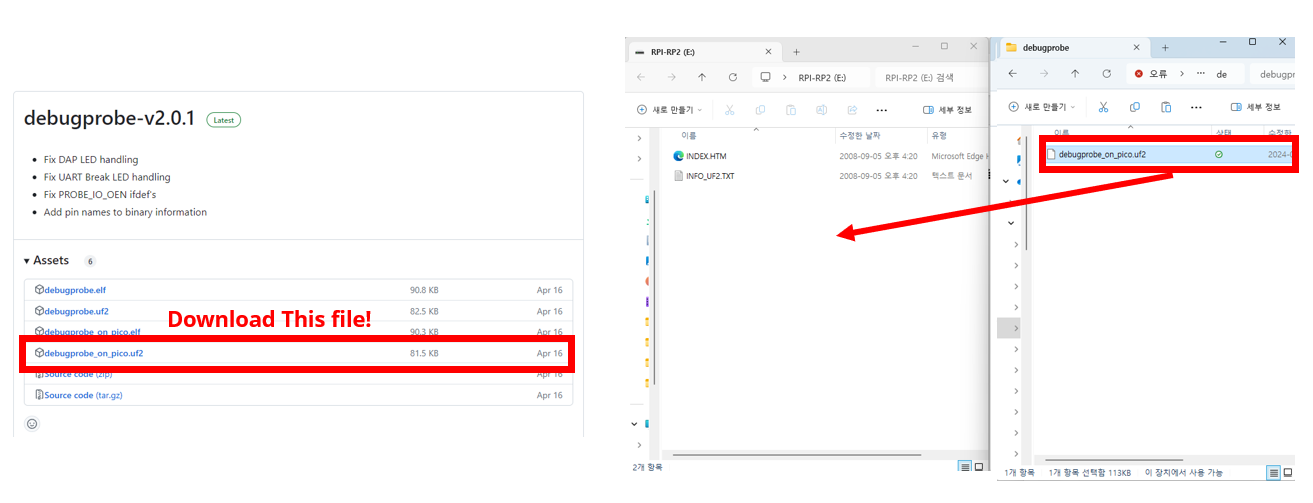
Download the UF2 file for the debugprobe from the link below and upload it to the PICO connected via USB.
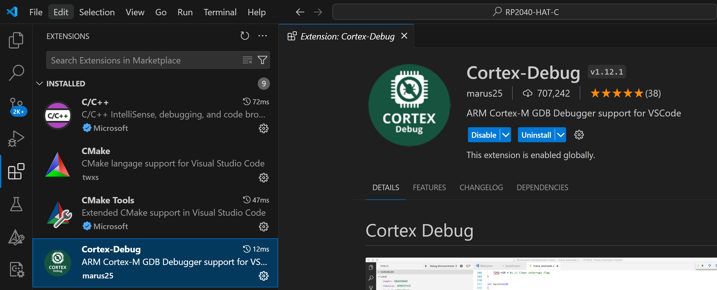
Search for Cortex-Debug in the Extensions tab and install it.
After connecting the Debugprobe to the target board via USB, open two Powershell prompts.
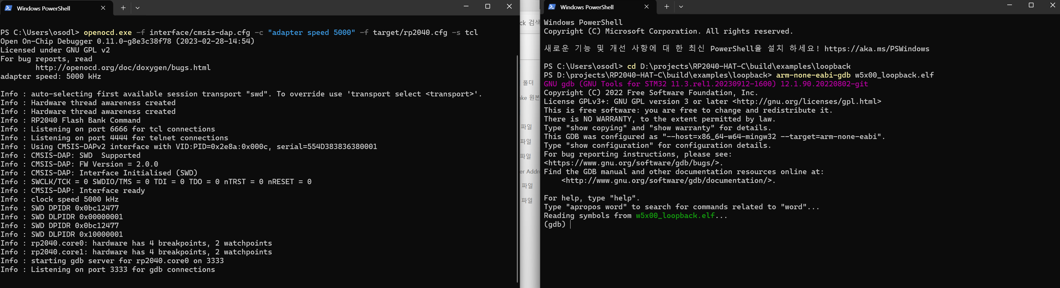
In one prompt for OpenOCD, enter:
openocd.exe -f interface/cmsis-dap.cfg -c "adapter speed 5000" -f target/rp2040.cfg -s tclIn the other prompt for gdb server, enter :
arm-none-eabi-gdb (target file name).elfReplace (target file name) with the name of your executable file.
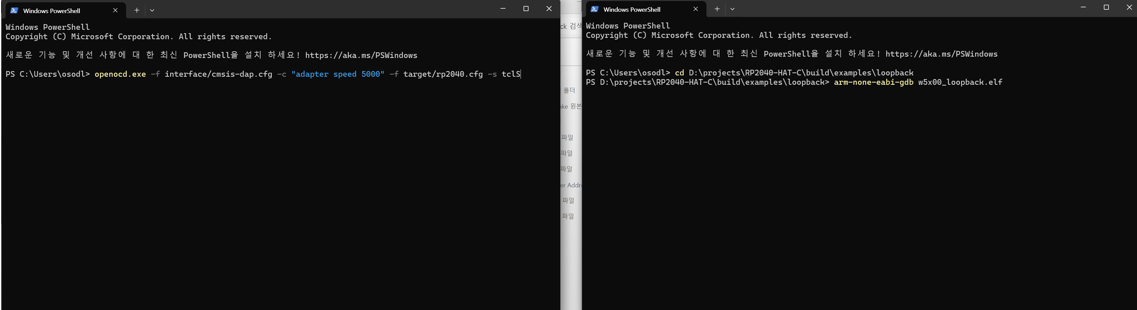
Here is an example of a successful execution screen:
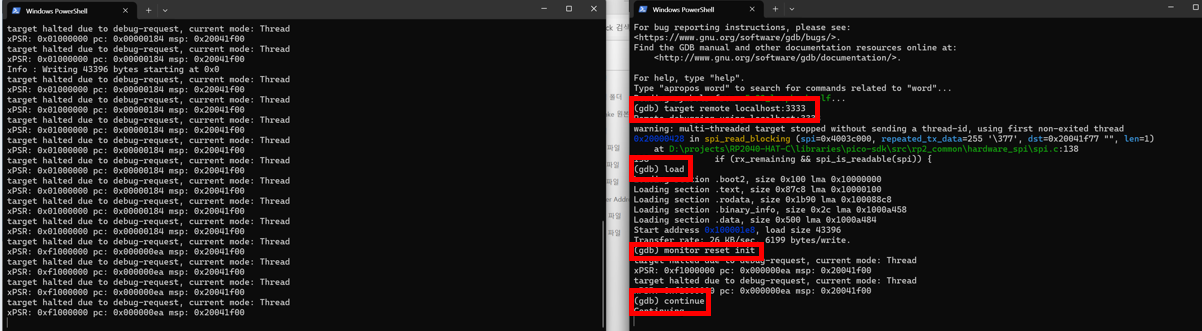
In the GDB prompt, you need to enter the following four commands to flash the ELF file to the target board. Refer to the image and commands below:
target remote localhost:3333
load
monitor reset init
continue
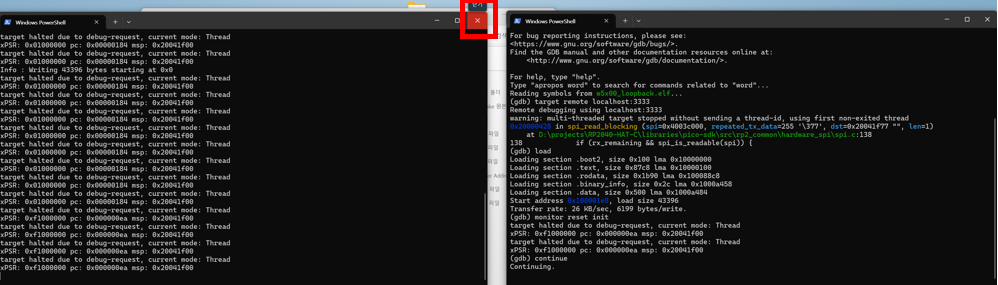
Once the firmware upload to the target board is complete, close the OpenOCD prompt on the left to disconnect from GDB.
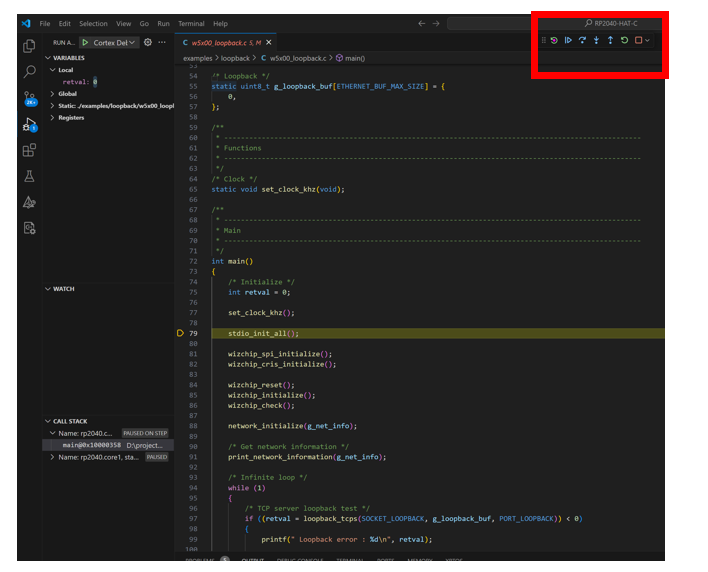
Click on the Debugger tab on the left side of VS Code. Then, click the play button to start the debugger.
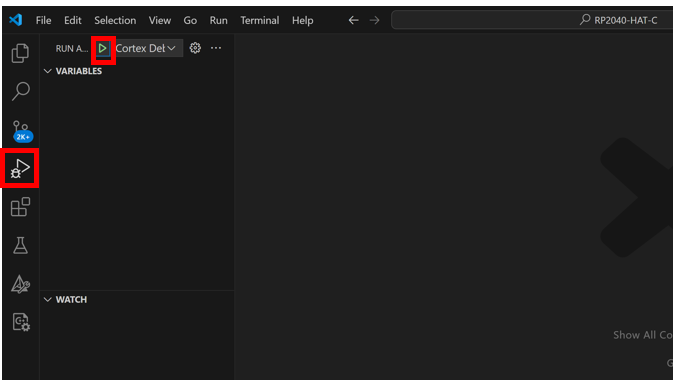
You can start debugging by using the debugger controls at the top, as shown below.