
SerVision - IoT room server monitoring
Monitor a server room with LoRa/LoRaWAN network. Portainer, Node-Red, InfluxDB, Grafana, Website, TTN, Downlink, email alert sender.
[English Version]
SerVision: Visualizing Server Room Integrity via W5500 and Node-RED
1. Introduction
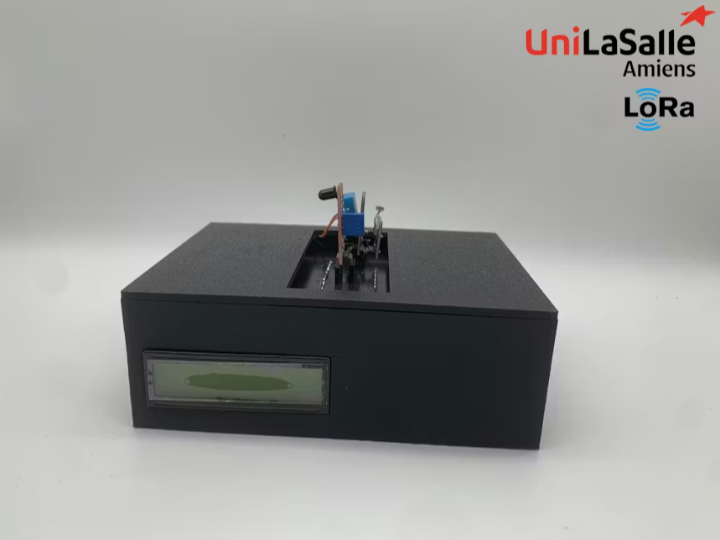
'SerVision' is a practical IoT solution that monitors server room environments and network connectivity. By combining Arduino Leonardo,Arduino Ethernet Shield 2 and LoRaWAN, it transmits critical data to a Docker-based backend for real-time visualization and alerting.
2. Core Technology and Environment
Data Acquisition & Connectivity: Arduino Leonardo reads 5 sensors, while the WIZnet W5500 performs Ethernet-based IP ping tests. A SODAQ board then relays this data via LoRaWAN.
Backend Stack (Docker/Portainer): * Node-RED: The central logic engine for data routing.
InfluxDB: Time-series database for historical sensor logs.
Apache/PHP: Web server for the custom user dashboard.
The Environment: A server room requires dual-layer monitoring—not just physical conditions like fire/heat, but also the connectivity status of local and public gateways.
3. Core Objective and WIZnet's Contribution
Project Goal: To establish a fail-safe monitoring pipeline where environmental alerts and network diagnostic data are accessible from any web browser.
Why WIZnet (W5500)? The system must ping three different IP addresses (Local, Gateway, Public) every minute. The W5500 handles these network tasks in hardware, allowing the Arduino to maintain stable sensor polling without the crashes often associated with software TCP/IP stacks on low-spec MCUs.
The Contribution: W5500 provides the reliable "Network Diagnostic Interface." It ensures that the system can distinguish between a sensor failure and a network outage, transmitting this status through the LoRa backup.
4. Deep Dive: The Visualization and Logic Flow
"Turning Raw Packets into Actionable Insights via Node-RED"
The true value of this project lies in how the backend processes the data frames received from the W5500 and LoRa link:
Node-RED Data Pipeline:
MQTT In: Subscribes to the TTN (The Things Network) broker to receive the 64-bit binary payload.
Payload Decoder: A custom JavaScript function parses the binary data into readable JSON (e.g., Temperature, Humidity, Flame Status, IP Status).
Logic Branching: If the Flame value is 1 or Temperature exceeds a threshold, Node-RED triggers an SMTP Gmail node to send instant alerts.
Dashboard Visualization:
Gauges & Charts: Real-time displays for temperature and humidity, with historical line graphs from InfluxDB.
Connectivity Status LEDs: A visual grid showing the status of the three IP pings performed by the W5500 (Green for success, Red for failure).
Remote Control (Downlink):
Users can input new target IP addresses on the web dashboard. Node-RED sends this as a Downlink command via HTTP API back to the W5500/Arduino to reconfigure the network test logic on the fly.
5. Strategic Value and Scalability
WIZnet’s Value: This project demonstrates that the W5500 is not just for "sending data" but is an essential tool for "network diagnostics" in industrial IoT.
Scalability: The Node-RED + InfluxDB stack can be easily expanded to manage hundreds of W5500-based nodes across multiple server racks, providing a centralized control center.
[한국어 버전]
SerVision: W5500과 Node-RED로 구현하는 서버실 관제 데이터 시각화
1. 개요
'SerVision'은 서버실의 환경 지표와 네트워크 연결 상태를 동시에 감시하는 실용적인 IoT 솔루션입니다. **아두이노 레오나르도와 Arduino Ethernet Shield 2와 LoRaWAN을 결합하여 수집된 데이터를 Docker 기반 백엔드에서 실시간으로 시각화하고 관리합니다.
2. 핵심 기술 및 환경
데이터 수집 및 통신: 아두이노 레오나르도가 5종의 센서를 제어하고, 위즈네트 W5500이 이더넷 기반의 IP 핑 테스트를 수행합니다. 수집된 정보는 SODAQ 보드를 통해 LoRaWAN으로 전송됩니다.
백엔드 스택 (Docker/Portainer): * Node-RED: 데이터 라우팅 및 알람 로직을 담당하는 핵심 엔진.
InfluxDB: 센서 로그 이력을 저장하는 시계열 데이터베이스.
Apache/PHP: 사용자 맞춤형 대시보드를 제공하는 웹 서버.
운영 환경: 화재/열기 같은 물리적 상태뿐만 아니라, 로컬 게이트웨이와 공용망의 연결성까지 실시간으로 체크해야 하는 서버실 환경에 최적화되어 있습니다.
3. 핵심 목적 및 위즈네트의 기여
프로젝트 목표: 모든 웹 브라우저에서 서버실의 환경과 네트워크 진단 데이터를 실시간으로 확인하고, 이상 발생 시 즉각적인 알림을 받는 시스템 구축입니다.
W5500의 필요성: 시스템은 매분마다 3개의 다른 IP(로컬, 게이트웨이, 외부망)에 핑을 보내야 합니다. W5500은 이 네트워크 부하를 하드웨어적으로 처리하여, 저사양 아두이노가 센서 값 읽기와 통신 처리를 동시에 수행하면서도 시스템 멈춤 없이 안정적으로 작동하도록 돕습니다.
기여도: W5500은 신뢰할 수 있는 '네트워크 진단 인터페이스' 역할을 합니다. 센서 고장과 망 장애를 명확히 구분할 수 있는 데이터를 제공하며, 이 정보는 LoRa 백업망을 통해 최종 관리자에게 전달됩니다.
4. 핵심 기술 퓌어보기: 시각화 및 로직 흐름
"Node-RED를 통한 로우 데이터의 정보화"
이 프로젝트의 핵심은 W5500과 LoRa를 통해 들어온 데이터 프레임이 백엔드에서 처리되는 방식에 있습니다.
Node-RED 데이터 파이프라인:
MQTT In: TTN(The Things Network) 브로커로부터 64비트 바이너리 페이로드를 수신합니다.
페이로드 디코더: 자바스크립트 함수를 통해 바이너리 데이터를 사람이 읽을 수 있는 JSON(온도, 습도, 화재 여부, IP 상태 등)으로 변환합니다.
알람 로직: 화재 감지값이 1이거나 온도가 임계치를 넘으면, Node-RED가 SMTP 노드를 통해 즉시 관리자에게 이메일 경보를 발송합니다.
대시보드 시각화 구성:
게이지 및 차트: 온습도 실시간 수치를 보여주는 게이지와 InfluxDB에서 가져온 과거 이력 그래프를 표시합니다.
연결 상태 LED: W5500이 수행한 3개 지점의 IP 핑 결과를 녹색(정상)/적색(장애) LED 형태로 한눈에 보여줍니다.
원격 제어 (Downlink):
사용자가 웹 대시보드에서 새로운 핑 대상 IP를 입력하면, Node-RED가 이를 다운링크 명령으로 변환하여 다시 W5500/아두이노로 전송, 현장의 네트워크 테스트 설정을 실시간으로 변경합니다.
5. 가치 제안 및 확장성
위즈네트의 전략적 가치: 본 사례는 W5500이 단순한 '데이터 전송용'을 넘어 산업용 IoT의 **'네트워크 진단 도구'**로서 필수적임을 보여줍니다.
향후 응용 분야: Node-RED와 InfluxDB 기반의 이 스택은 여러 서버 랙에 분산된 수백 개의 W5500 노드를 통합 관리하는 중앙 집중식 관제 센터로 쉽게 확장할 수 있습니다.