TinyML(2) - using low-sensitivity sensor to predict high-performance sensor
This project uses low-sensitivity sensor data to predict temperature and humidity from high-performance sensor using TinyML.

Summary
This post covers how to improve the performance difference between high-cost sensors and low-cost sensors using AI neural networks. The authors note that the humidity measured by the company's low-cost sensors differed significantly from higher-cost sensors. To solve this, the authors present a method to improve the performance of low-cost sensors by training a neural network model based on data collected using multiple low-cost sensors. As a result of the experiment, the neural network succeeded in predicting data from low-cost sensors similar to data from high-cost sensors, which is meaningful in that it suggests a way to maintain accuracy while reducing sensor costs. Additionally, the process of using TinyML for efficient data management and model quantization is described.
Introduction
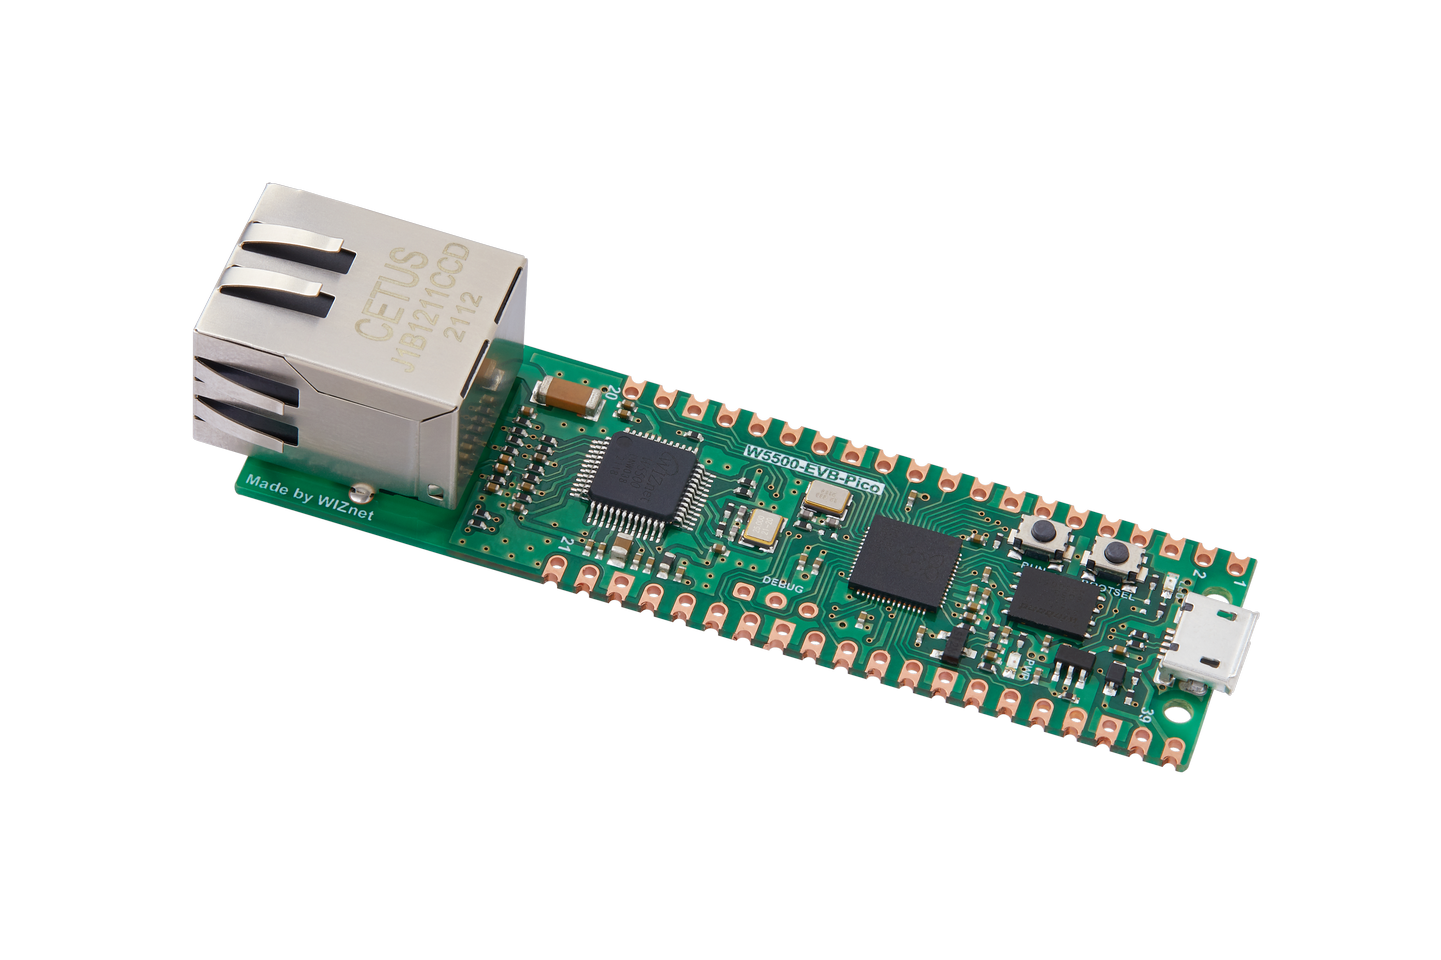
From a business perspective, using AI in the W5500-EVB-Pico (RP2040) chip can be expected to reduce traffic and reduce costs.
Configuration of high-cost and low-cost sensors
high cost sensor
Temperature error: ±0.5 C
Humidity: ±2%
low cost sensor
Temperature error: ± 2 C
Humidity: ± 5%
In the case of low-cost sensors, the humidity was displayed at about +-5%, but the actual measurement results were very different from those of high-cost sensors.
As you will see when you check the data later, at the time of measurement at the company I work for, low-priced sensors recorded humidity of about 0-10%, while high-priced sensors recorded humidity of about 30-40%. Based on this data, the performance of the sensor can be improved through prediction through a neural network, and at the same time, the performance of low-cost sensors can be improved by utilizing multiple low-cost sensors without expensive sensors.
Project configuration
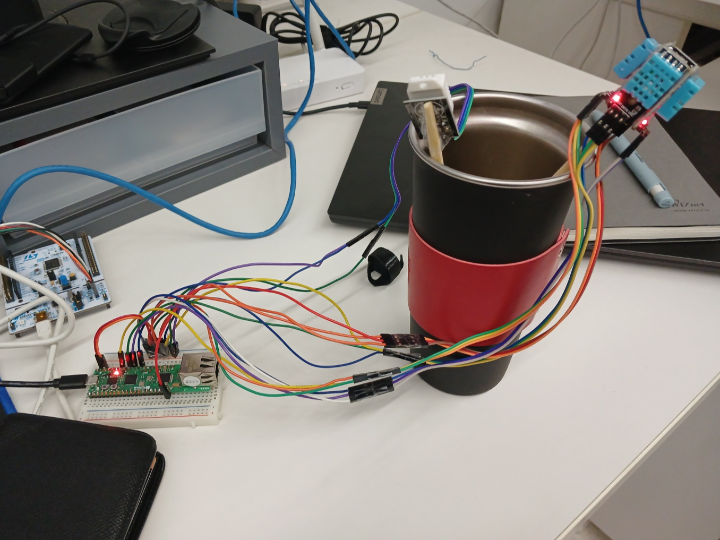
Measure one high-cost sensor and several low-cost sensors in the same environment as possible.
It looks like four low-sensitivity sensors are attached.
Data Collection
In the case of data collection, data was collected through serial communication between my computer and Pico through Python code. In the case of Pico, sensor data was collected every 10 seconds and transmitted to Python, and in the case of Python, the data received serially was accumulated as a csv file.
tem_humid.ino
#include "DHT.h"

//0,1,7,15,16
#define low_dt1 15
#define low_dt2 28
#define low_dt3 27
#define low_dt4 26
#define high_dt 22


DHT low_Dht1(low_dt1, DHT11);
DHT low_Dht2(low_dt2, DHT11);
DHT low_Dht3(low_dt3, DHT11);
DHT low_Dht4(low_dt4, DHT11);
DHT high_Dht(high_dt, DHT22);

void setup() {
  Serial.begin(9600);
  low_Dht1.begin();
  low_Dht2.begin();
  low_Dht3.begin();
  low_Dht4.begin();
  high_Dht.begin();
}

void loop() {

    // 센서의 온도와 습도를 읽어온다.
  float low1_h = low_Dht1.readHumidity();
  float low1_t = low_Dht1.readTemperature();
  float low2_h = low_Dht2.readHumidity();
  float low2_t = low_Dht2.readTemperature();
  float low3_h = low_Dht3.readHumidity();
  float low3_t = low_Dht3.readTemperature();
  float low4_h = low_Dht4.readHumidity();
  float low4_t = low_Dht4.readTemperature();
  float high_h = high_Dht.readHumidity();
  float high_t = high_Dht.readTemperature();

  if (isnan(low1_h) || isnan(low1_t)|| isnan(low2_h) || isnan(low2_t)|| isnan(low3_h)
  || isnan(low3_t)|| isnan(low4_h) || isnan(low4_t)|| isnan(high_h) || isnan(high_t) ) {
    //값 읽기 실패시 시리얼 모니터 출력
    Serial.println("Failed to read from DHT");
  } else {
    //온도, 습도 표시 시리얼 모니터 출력
    Serial.print(String(low1_h) + " "+String(low1_t) + " "+String(low2_h) + " "+String(low2_t) + " "+String(low3_h) + " "+String(low3_t) +
    " "+String(low4_h) + " "+String(low4_t) + " "+String(high_h) + " "+String(high_t)+ "\n");
  }
  delay(10000);

}
Temperature and humidity sensor data is transmitted through serial communication once every 10 seconds.
getdata.py
import serial
import csv
import os
from datetime import datetime

# 시리얼 포트 설정
ser = serial.Serial('COM13', 9600)

# CSV 파일 설정
filename = "sensor_data.csv"
file_exists = os.path.isfile(filename)  # 파일이 이미 존재하는지 확인
row_count = 0
with open(filename, 'r') as file:
    reader = csv.reader(file)
    row_count = sum(1 for row in reader)  # 모든 행을 순회하며 세기


with open(filename, 'a', newline='') as file:  # 'a' 모드로 파일 열기
    writer = csv.writer(file)
    if not file_exists:
        writer.writerow(["Timestamp", "Low1_Humidity", "Low1_Temperature", "Low2_Humidity", "Low2_Temperature",
                         "Low3_Humidity", "Low3_Temperature", "Low4_Humidity", "Low4_Temperature",
                         "High_Humidity", "High_Temperature"])  # 파일이 새로 생성되면 컬럼명 추가

    print("온,습도가 기록중입니다...")
    while True:
        if ser.in_waiting:
            data = ser.readline().decode('utf-8').rstrip()
            if data and "Failed to read from DHT" not in data:
                row_count += 1
                data_list = data.split(" ")
                data_list.insert(0, datetime.now().strftime("%Y-%m-%d %H:%M:%S"))
                print(f"DataCount: {row_count} | DataStamp: {data_list}", end='\r')
                writer.writerow(data_list)
                file.flush()
Save data received through serial communication as a csv file.
Data file(.csv)
Approximately 4400 pieces of data are accumulated. The actual humidity within the company was maintained at around 35-40%, but the humidity recorded by the four low-cost sensors was within 0-12%. For this reason, sensor value correction through AI (neural network) can be considered more meaningful.
Construct and train neural network models
# 입력 및 타겟 데이터 선택
X = sensor_data[['Low1_Humidity', 'Low1_Temperature', 'Low2_Humidity', 'Low2_Temperature', 'Low3_Humidity', 'Low3_Temperature', 'Low4_Humidity', 'Low4_Temperature']]
y = sensor_data[['High_Humidity', 'High_Temperature']]

# 데이터 분할: 훈련 세트와 테스트 세트
X_train, X_test, y_train, y_test = train_test_split(X, y, test_size=0.2, random_state=42)

# 추가 데이터 분할: 훈련 세트를 다시 훈련 세트와 검증 세트로 분할
X_train, X_val, y_train, y_val = train_test_split(X_train, y_train, test_size=0.25, random_state=42)  # 전체 데이터의 20%가 검증 세트가 됨

# 결과 확인
X_train.shape, X_val.shape, X_test.shape

# 모델 생성
model = tf.keras.Sequential([
    tf.keras.layers.Dense(64, activation='relu', input_shape=(X_train.shape[1],)),
    tf.keras.layers.Dense(64, activation='relu'),
    tf.keras.layers.Dense(2)  # High_Humidity와 High_Temperature에 대한 출력
])

# 모델 컴파일: MAE 측정 추가
model.compile(optimizer='adam', loss='mean_squared_error', metrics=['mean_squared_error', 'mean_absolute_error'])

# 모델 훈련 및 평가
history = model.fit(X_train, y_train, epochs=450, batch_size=128, validation_data=(X_val, y_val))

# 모델 평가
loss, mse, mae = model.evaluate(X_test, y_test)
print(f"Test Loss: {loss}, Test MSE: {mse}, Test MAE: {mae}")
Test MSE: 0.41999197006225586, Test RMSE: 0.6480678745797047, Test MAE: 0.24979573488235474The MAE (Mean absolute error) is 0.25, which means that the average difference between the predicted value of the low-cost sensor and the high-cost sensor is only ±0.25. A result like this is excellent.
Looking at the correct answer, [Humidity, Temperature], the actual result recorded humidity 28.7%, temperature 27.9C, and the predicted value through the neural network showed humidity 29.01%, temperature 27.96C, showing an error of about 0.3%P including temperature and humidity.
Visualize and test model evaluation
In the case of the learning model, there was no sign of backpropagation even when trained for 1000 epochs. This is because more than 4,000 of the 4,400 data sets were measured at a humidity of 35 to 40% and a temperature of 27 to 29 C, so there was no significant change. If you follow this project, be sure to find a machine learning model that suits your environment through data analysis.
Quantize the model with the tflite extension. This completes the model setup for TinyML.
W5500 Evb Pico In TinyML
Models created with the .tflite extension cannot be used directly. You must create .h and .cpp models as shown below to use them in the Arduino environment. The creation command is as follows.
xxd -i your_model.tflite > model_data.cc
my_test_model.h
#ifndef TENSORFLOW_LITE_MICRO_EXAMPLES_TINYML_HYGROPREDICT_DATA_H_
#define TENSORFLOW_LITE_MICRO_EXAMPLES_TINYML_HYGROPREDICT_DATA_H_

extern const unsigned char g_hygropredict_model_data[];

#endif  // TENSORFLOW_LITE_MICRO_EXAMPLES_TINYML_HYGROPREDICT_DATA_H_
my_test_model.cpp
#include "tensorflow/lite/micro/examples/TinyML-HygroPredict/my_test_model.h"

// We need to keep the data array aligned on some architectures.
#ifdef __has_attribute
#define HAVE_ATTRIBUTE(x) __has_attribute(x)
#else
#define HAVE_ATTRIBUTE(x) 0
#endif
#if HAVE_ATTRIBUTE(aligned) || (defined(__GNUC__) && !defined(__clang__))
#define DATA_ALIGN_ATTRIBUTE __attribute__((aligned(4)))
#else
#define DATA_ALIGN_ATTRIBUTE
#endif

unsigned const char g_hygropredict_model_data[] = {
  0x1c, 0x00, 0x00, 0x00, 0x54, 0x46, 0x4c, 0x33, 0x14, 0x00, 0x20, 0x00,
  0x1c, 0x00, 0x18, 0x00, 0x14, 0x00, 0x10, 0x00, 0x0c, 0x00, 0x00, 0x00,
  0x08, 0x00, 0x04, 0x00, 0x14, 0x00, 0x00, 0x00, 0x1c, 0x00, 0x00, 0x00,
  0x94, 0x00, 0x00, 0x00, 0xec, 0x00, 0x00, 0x00, 0x08, 0x4e, 0x00, 0x00,
  0x18, 0x4e, 0x00, 0x00, 0x28, 0x53, 0x00, 0x00, 0x03, 0x00, 0x00, 0x00,
  0x01, 0x00, 0x00, 0x00, 0x10, 0x00, 0x00, 0x00, 0x00, 0x00, 0x0a, 0x00,
  0x10, 0x00, 0x0c, 0x00, 0x08, 0x00, 0x04, 0x00, 0x0a, 0x00, 0x00, 0x00,
  0x0c, 0x00, 0x00, 0x00, 0x1c, 0x00, 0x00, 0x00, 0x38, 0x00, 0x00, 0x00,
  0x0f, 0x00, 0x00, 0x00, 0x73, 0x65, 0x72, 0x76, 0x69, 0x6e, 0x67, 0x5f,
   ...
   ...
  0x64, 0x65, 0x66, 0x61, 0x75, 0x6c, 0x74, 0x00, 0x01, 0x00, 0x00, 0x00,
  0x04, 0x00, 0x00, 0x00, 0x94, 0xff, 0xff, 0xff, 0x09, 0x00, 0x00, 0x00,
  0x04, 0x00, 0x00, 0x00, 0x07, 0x00, 0x00, 0x00, 0x64, 0x65, 0x6e, 0x73}
Once you have the quantized model, all you have to do is run it in ArduinoIDE!
Build on Arduino
main.ino
#include "DHT.h"
#include <TensorFlowLite.h>
#include "main_functions.h"
#include "constants.h"
#include "my_test_model.h"
#include "tensorflow/lite/micro/kernels/all_ops_resolver.h"
#include "tensorflow/lite/micro/micro_error_reporter.h"
#include "tensorflow/lite/micro/micro_interpreter.h"
#include "tensorflow/lite/schema/schema_generated.h"
#include "tensorflow/lite/version.h"
// 센서 핀 정의
#define low_dt1 15
#define low_dt2 28
#define low_dt3 27
#define low_dt4 26
#define high_dt 22
DHT low_Dht1(low_dt1, DHT11);
DHT low_Dht2(low_dt2, DHT11);
DHT low_Dht3(low_dt3, DHT11);
DHT low_Dht4(low_dt4, DHT11);
DHT high_Dht(high_dt, DHT22);
namespace {
tflite::ErrorReporter* error_reporter = nullptr;
const tflite::Model* model = nullptr;
tflite::MicroInterpreter* interpreter = nullptr;
TfLiteTensor* input = nullptr;
TfLiteTensor* output = nullptr;
constexpr int kTensorArenaSize = 8 * 1024;
uint8_t tensor_arena[kTensorArenaSize];
}
void setup() {
Serial.begin(9600);
low_Dht1.begin();
low_Dht2.begin();
low_Dht3.begin();
low_Dht4.begin();
high_Dht.begin();
static tflite::MicroErrorReporter micro_error_reporter;
error_reporter = µ_error_reporter;
model = tflite::GetModel(g_hygropredict_model_data);
if (model->version() != TFLITE_SCHEMA_VERSION) {
TF_LITE_REPORT_ERROR(error_reporter, "Model schema version mismatch!");
return;
}
static tflite::ops::micro::AllOpsResolver resolver;
static tflite::MicroInterpreter static_interpreter(model, resolver, tensor_arena, kTensorArenaSize, error_reporter);
interpreter = &static_interpreter;
if (interpreter->AllocateTensors() != kTfLiteOk) {
Serial.println("Failed to allocate tensors!");
return;
}
input = interpreter->input(0);
output = interpreter->output(0);
}
// The name of this function is important for Arduino compatibility.
void loop() {
// 센서값 읽기
float low1_h = low_Dht1.readHumidity();
float low1_t = low_Dht1.readTemperature();
float low2_h = low_Dht2.readHumidity();
float low2_t = low_Dht2.readTemperature();
float low3_h = low_Dht3.readHumidity();
float low3_t = low_Dht3.readTemperature();
float low4_h = low_Dht4.readHumidity();
float low4_t = low_Dht4.readTemperature();
float high_h = high_Dht.readHumidity();
float high_t = high_Dht.readTemperature();
if (isnan(low1_h) || isnan(low1_t)|| isnan(low2_h) || isnan(low2_t)|| isnan(low3_h)
|| isnan(low3_t)|| isnan(low4_h) || isnan(low4_t)|| isnan(high_h) || isnan(high_t) ) {
//값 읽기 실패시 시리얼 모니터 출력
Serial.println("Failed to read from DHT");
}else {
// 입력 텐서에 센서 데이터 설정
input->data.f[0] = low1_h;
input->data.f[1] = low1_t;
input->data.f[2] = low2_h;
input->data.f[3] = low2_t;
input->data.f[4] = low3_h;
input->data.f[5] = low3_t;
input->data.f[6] = low4_h;
input->data.f[7] = low4_t;
// 모델 실행
if (interpreter->Invoke() != kTfLiteOk) {
Serial.println("Failed to invoke tflite!");
return;
}
// 출력 텐서에서 예측값 읽기
float predicted_high_h = output->data.f[0];
float predicted_high_t = output->data.f[1];
// 결과 출력
Serial.println("Predicted:[" + String(predicted_high_h) + ", " + String(predicted_high_t) +
"] Real:[" + String(high_h) + ", " + String(high_t) + "]");
}
delay(1500);
}
Load modules for using tfilte. In this example, since only sensor data is used, only tflite's essential header files, DHT, and my_test_model.h header files are loaded.
After initializing the sensors in setup(), measure the sensor values in loop(), inject the values into the quantized model, and compare the measured and predicted values. You can infer the input value of a neural network through the interpreter->Invoke() function. Afterwards, the resulting data is sequentially stored in the output->data.f[n] array. Below is the final execution result.
Result
There is no significant difference between the predicted value and the measured value of the high-performance sensor. If we can build a high-quality data set rather than a biased data set, I think it will have clearer predictive values.

