
Data visualization: How many user using ChannelTalk on wiznet?
Channel Talk is a chat consultation platform used by many companies for CS. Let’s check out what kind of people use Channel Talk on Wiznet.
PROJECT DESCRIPTION
Data visualization is a key tool for converting complex information into an intuitive and easy-to-understand form. Our brain recognizes images faster than letters or numbers, which speeds up the decision process and helps you avoid missing important insights. In particular, data generated from platforms such as Wiznet Channel Talk include various user behaviors, feedback, and tendencies, so structuring and visualization are essential to understand their meaning.
Visualization makes it easy to discover hidden patterns, correlations, and trends. This plays an important role in helping a company or organization nimbly respond to changes in the market and set a direction for service improvement. Additionally, using data visualization in your reports or presentations can help you increase understanding and communicate your point more effectively.
Ultimately, data visualization plays a key role in concisely expressing complex information and improving the accuracy and speed of decision-making. This allows companies or organizations to improve competitiveness and set strategic directions for the future.
How To Get ChannelTalk UserData?
Channel Talk provides customer data to administrators in xlsx or jsonl extension format. At this time, WCC downloaded it in xlsx format. Let’s check the data.
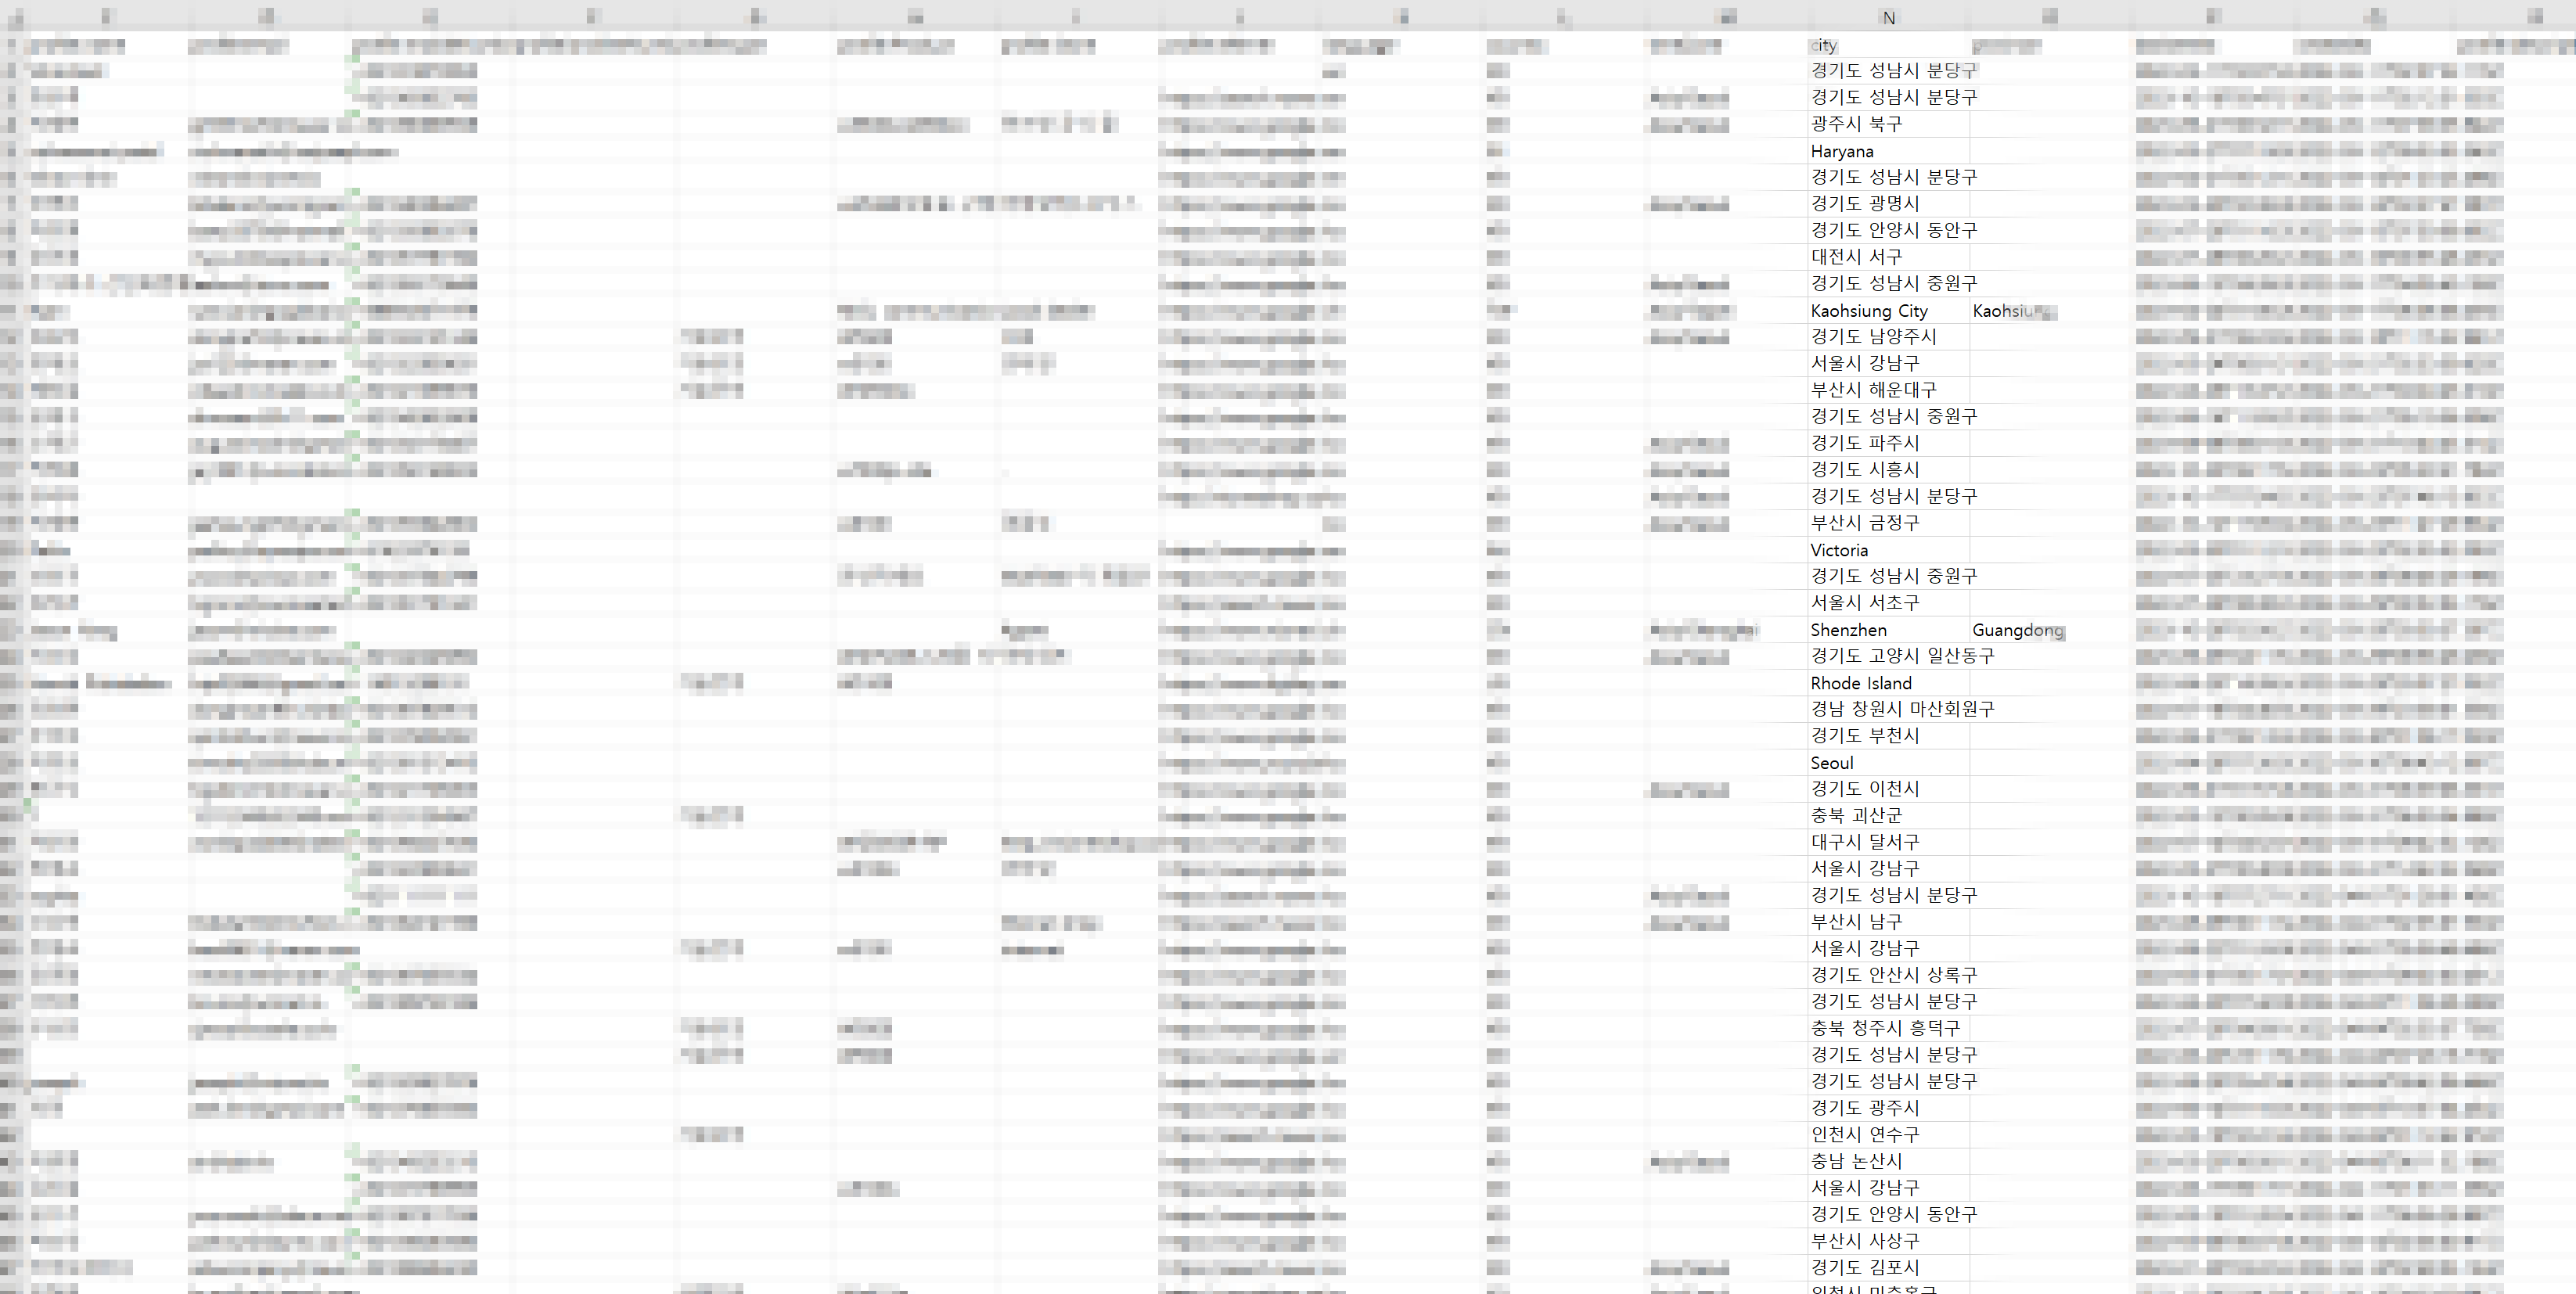
Channel Talk user analysis by region
Although there are various data columns, this WCC focused on “city” data to understand the characteristics and distribution of Channel Talk users by region. Through this, we analyzed what characteristics each region has and which regions have the highest usage of Channel Talk. Let's look at the photo below.
Edit address with latitude and longitude coordinates
We hold user address information in Channel Talk user data. This address data is useful for regional analysis or service provision, but latitude and longitude coordinate information is required for map-based analysis or visualization. Therefore, it is necessary to convert address information into latitude and longitude.
- Tools and data needed
Geocoding services or APIs (e.g. Google Maps Geocoding API, OpenStreetMap Nominatim, etc.) - Conversion procedure
Select the Geocoding service or API to use.
When you enter address data into the service, latitude and longitude information is returned.
Update the returned latitude and longitude information in the database or Excel file.
codes
from geopy.geocoders import Nominatim
geo_local = Nominatim(user_agent='South Korea')

# 위도, 경도를 반환하는 함수
def geocoding(address):
    try:
        geo = geo_local.geocode(address)
        x_y = [geo.latitude, geo.longitude]
        return x_y
    #특정하기 어려운 지역은 0,0으로 리턴.
    except:
        return [0,0]

latitude = []
longitude = []

for i in cities:
    latitude.append(geocoding(i)[0])
    longitude.append(geocoding(i)[1])
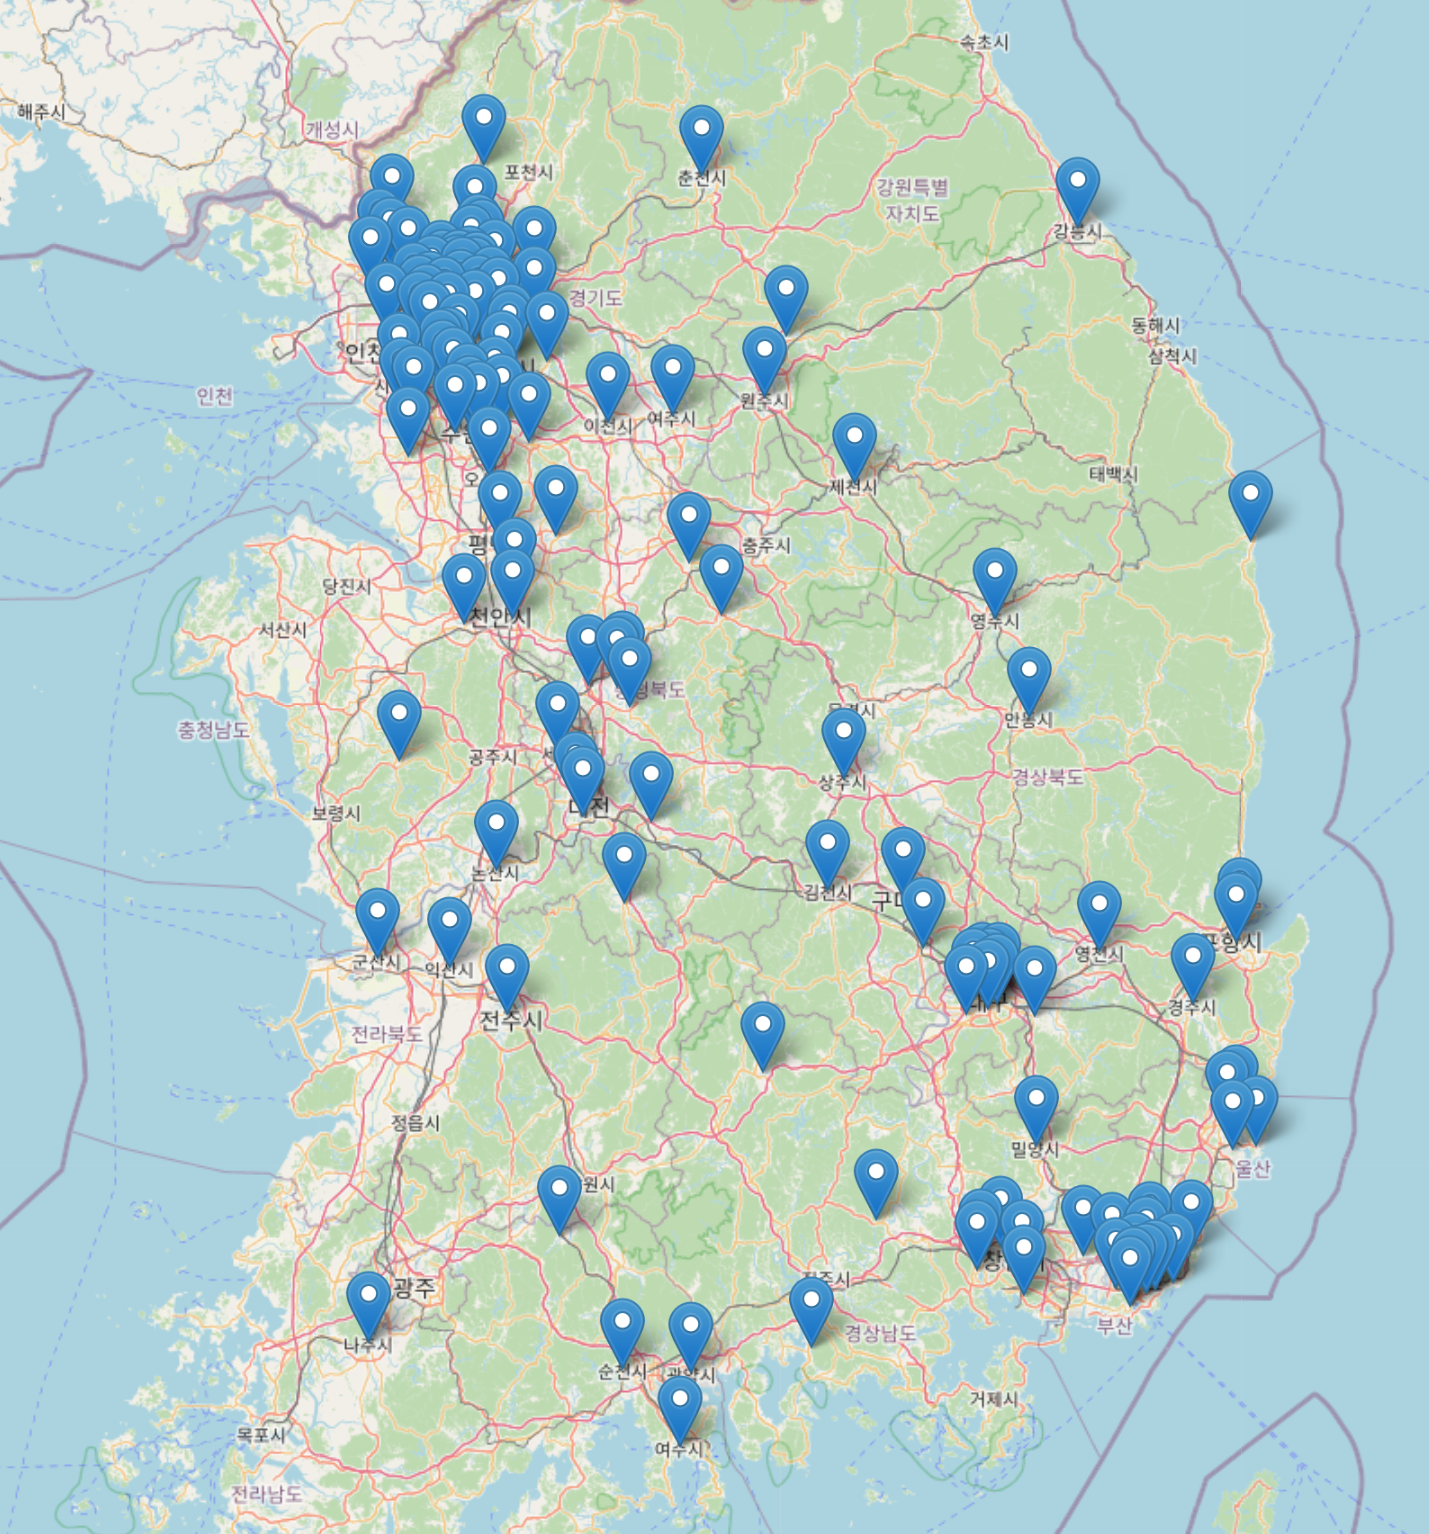
We conducted a map visualization to clearly understand the distribution of Channel Talk users. During this process, we used the marker function to accurately mark each user's location on the map. This allows you to easily check the distribution of users by region. This is the code for visualization ChannelTalk User.
codes
#User location data using ChannelTalk viewed as a marker
import folium

# 초기 지도 생성 (첫 번째 좌표로 중심 설정)
m = folium.Map(location=[latitude[0], longitude[0]], zoom_start=10)

# 각 좌표를 지도에 표시
for lat, lon in zip(latitude, longitude):
    folium.Marker([lat, lon]).add_to(m)
Below is an enlarged photo so that Korean users can see it.
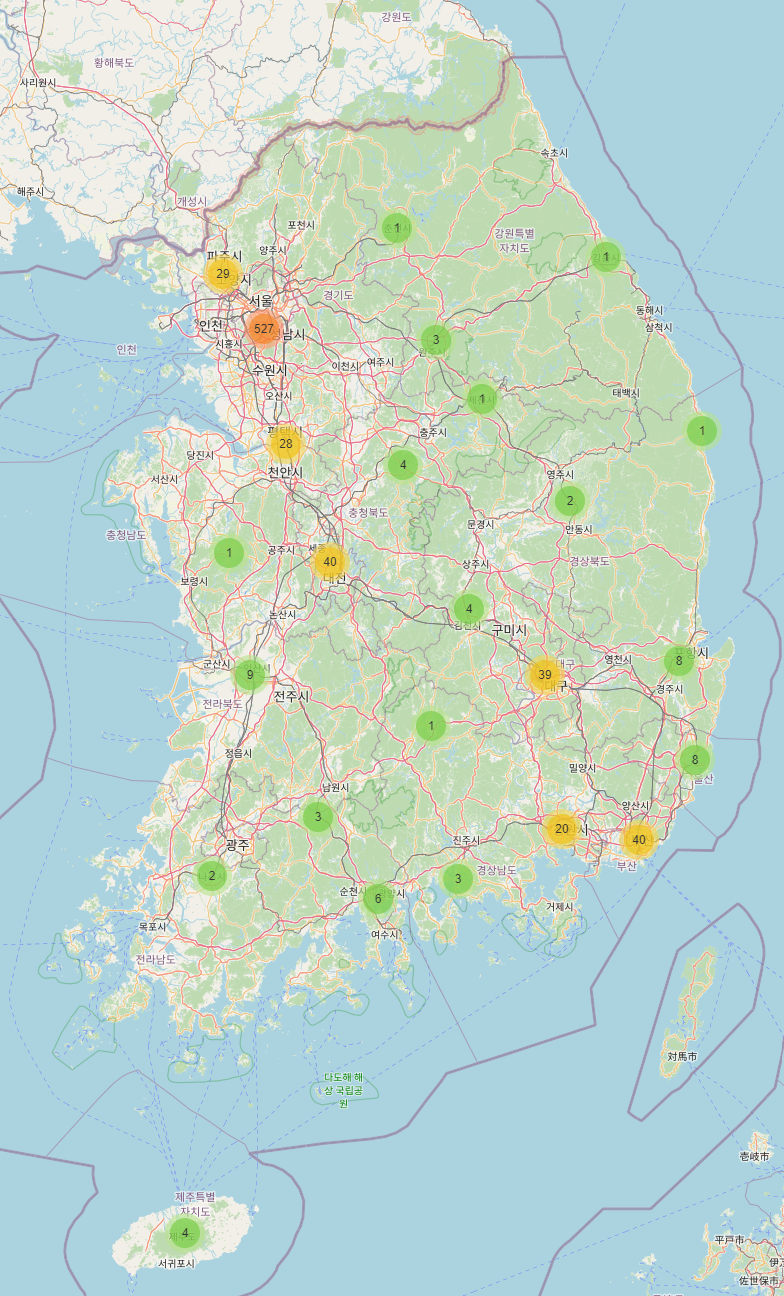
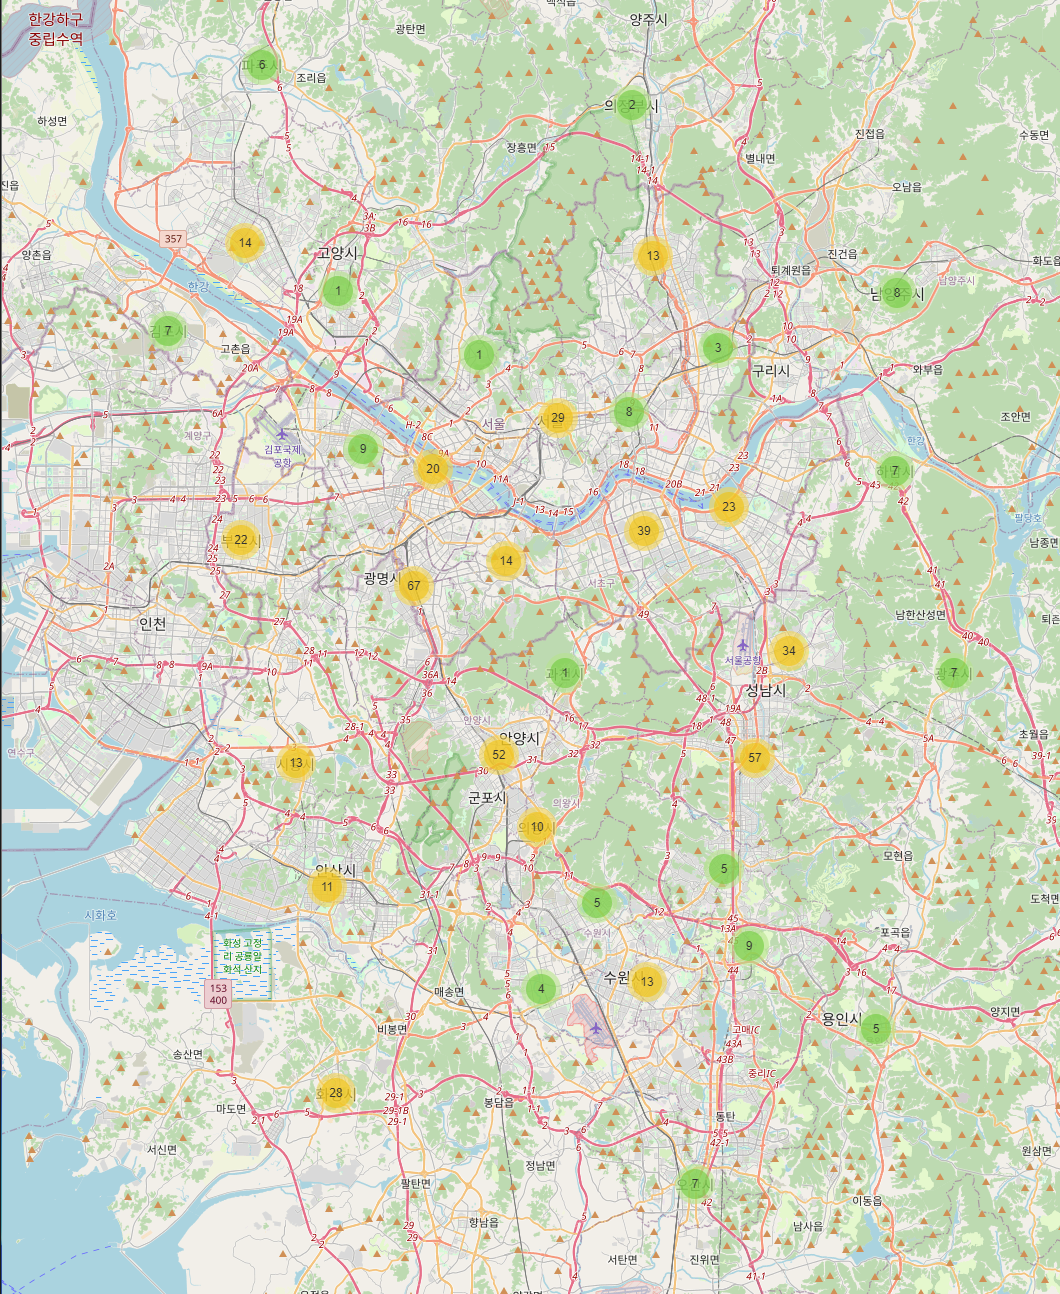
However, if the number of users increases, a situation may arise where markers overlap on the map, making it difficult to view. To solve this problem, we introduced markercluster to perform clustering according to the distribution of users and display the number of users in each cluster to provide cleaner and more intuitive visualization.
codes
# User location data using ChannelTalk viewed as a markercluster
from folium.plugins import MarkerCluster

# 초기 지도 생성 (첫 번째 좌표로 중심 설정)
m = folium.Map(location=[latitude[0], longitude[0]], zoom_start=10)

# MarkerCluster 객체 생성, single_marker_mode=True로 설정
marker_cluster = MarkerCluster(single_marker_mode=True).add_to(m)

# 각 좌표를 MarkerCluster에 추가
for lat, lon in zip(latitude, longitude):
    folium.Marker([lat, lon]).add_to(marker_cluster)
Below is an enlarged photo so that Korean users can see it.
The analysis and visualization of Channel Talk data conducted this time was easy and simple. In the future, we plan to explore other data sources and reveal deeper insights through various visualizations. The goal is not simply to display data, but to select and analyze key data that can help with business strategy and decision-making. Future data visualization will include analysis of the following problems.
- Respond to market changes: Data reflects rapid changes in the market and consumer behavior patterns. We will continuously monitor data to detect these changes and respond quickly.
- Improving user experience: In addition to Channel Talk, we will focus on improving the quality of service by analyzing user feedback and experiences at various touchpoints.
- Strengthening competitiveness: In order to gain an upper hand in the business environment, we will identify our strengths and weaknesses through comparative analysis with competitors' data and establish strategies accordingly.
Data plays a critical role in modern business. Through this, WIZNET can move forward in a more sustainable and efficient direction.
If you have any questions, please refer to the provided code and files.
-
ChannelTalk_Structing

-
ChannelMarker
-
ChannelMarkerCluser