
Wireless Sensor Network Design for Earthquake’s and Landslide’s Early Warnings
Indonesia is located at the junction of three tectonic plates, and the Maluku Island it self has 10 fault line zones, so the impact.

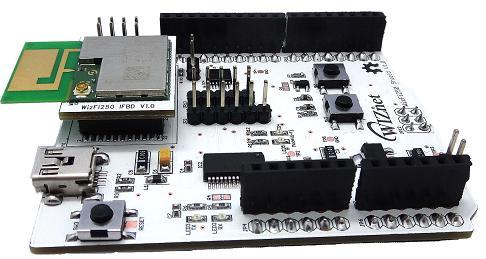
WIZnet - WizFi250
x 1
Indonesia is located at the junction of three tectonic plates Eurasian plate, the Pacific plate and the Australian plate. These plates meet in the Maluku islands forming a trough, which has a depth of between (4500-7000) meter, known as a subduction zone. The Ambon Island has ten fault zones, and three of them are in densely populated residential areas. The area from Pattimura Street to Batumeja Street is a region included in one of the fault zones. These fragments will be activated in case of a large earthquake [1].

Goals and Objectives Here, an integrated system for monitoring an earthquake and landslides indication is designed. The nodes inside the system are linked in a Wireless Sensor Network (WSN), and the WSN is connected to the internet via a coordinator node by a WiFi technology shield and GPRS (General Packet Radio Service). This study includes the creation indication WSN monitoring system of earthquake and landslide by filing a star topology as well as utilizing ZigBee technology for wireless data transmission in WSN and GSM (Global System for Mobile Communications) or GPRS for communication via SMS (Short Message Service). In addition, information on real time earthquakes and landslides is shown applicative web-based interface.

Hardware and Software The hardware modules used in this study are Arduino SW-420-NC modules (end devices implemented on North and South sides of the coordinator) and sensors modules for rainfall intensity detection (implemented in the end devices eastern and east sides of the coordinator). Microcontroller modules used are the Arduino Mega (Atmega2560) with Gboard Pro-900 GSM SIM. For communicating purposes, XBee Socket communication boards, XBee 2mW Wire Antenna - Series 2, and WiznetFi250-based Arduino WiFi Shield are used. The overall designed system is shown in Figure 3. The software used in this study is the Arduino IDE, Wireshark V2.4.5 and X-CTU.

System Testing The system was tested by measuring the parameters of Quality of Service (QoS), namely Throughput (1), Packet Loss Ratio (2), Delay (3) and also measuring the signal strength in term of Received Signal Strength Indicator (4). Analyzing the WSN network was conducted to determine the performance of a real system environment and some measurements on the eastern station node (earthquake sensor) for 4 days were done to see the reliability of the system. Furthermore, the system was tested in real time by accessing the website of the local host WiFi Shield system, which displays the current status of the state of the sensors or end devices.
RESULTS AND DISCUSSION 4.1 Analysis Throughput, Delay, Packet Loss Ratio, Respons Time of System Table 2 shows the measured results of the Quality of Service (QoS) analysis of the system, and the RSSI. Table 2 shows an optimum throughput with an average value of 1488 Kbps, the average delay of 0.045 seconds, the average packet loss ratio below 0%, and the RSSI of -31 dBm, in a 20 meter node station distance scenario to a coordinator node monitored through a monitoring center. The results are not too far from measured at another distance scenarios, 1470 Kbps for the throughput average, delay average is 0.049 seconds, packet loss ratio 0.02%, and RSSI -40 dBm in scenarios of 40 meters. In 60 meter scenario, the results are 1465 Kbps for throughput average, delay average is 0.048 seconds, packet loss ratio 0.11%, and RSSI -56 dBm. In 80 meter scenario, the results are 1432 Kbps for throughput average, delay average is 0.051 seconds, packet loss ratio 0.42%, and RSSI -79 dBm. At last in 100 meter node station distance scenario to a coordinator node, the results are 1385 Kbps for throughput average, delay average is 0.052 seconds, packet loss ratio 0.68%, and RSSI -85 dBm. The communication system can still pass the data packets from each node station in the field to the node coordinator and monitored through the monitoring center. So, the communication system is acceptable and reliable to pass the data packets from each node station in the field to the node coordinator and monitored through the monitoring center.

Testing of Reliability and Optimal System Performance Table 4 shows the measurement results of rainfall intensity in the real research location conducted for 29 days on south node station, it started on 02/12/2017 until 30/12/2017. Through measurement using water level sensor and ombrometer level sensor (south node station) on the system, heavy rainfall was detected with the intensity 60.61 mm or 803,208 logic (on 02/12/2017) and 83.86 mm or 718,617 logic (on 11/12/2017). While very heavy rain occurred with the intensity of 159.65 mm or 443,154 logic (on 09/12/2017) and 108.08 mm 630,411 logic (on 16/12/2017). The phenomenon of heavy and very heavy rainfall are detected by the system and the system follows up the information by activating the alarm buzzer and sends a warning SMS notification to the monitors. By analysing the measurements as given in Table 4, the landslides can potentially occurs by a very heavy rainfall factor with 159.65 mm or 443,154 logic (on 09/12/2017), this condition is supported by detection of mild shakes for a while around the location by the systems through a 751-logical digital input- display on the website page or equivalent to 4.2 RS and it released with notifications including SMS notification at 12.32 WIT.

The Monitoring Integrated System via Website and SMS Additionally we show the notification of the monitoring system of earthquakes and landslides through website and SMS. We connected the Wifi network-shield to the system, and used the url: http://192.168.4.1. Figure 4 shows the page display of the real-time monitoring.

After testing by accessing website air monitoring system in real-time running properly. The system is able to provide information about the value of rainfall intensity and vibration status in real-time. For the scenario the system detects vibrations of 3.0 magnitude and intensity of rainfall over 50 mm per day, so that the system automatically provides information in the form of SMS to the researcher is shown in Figure 5.

CONCLUSION The system was built to monitor and to provide information on the rainfall intensity and vibration through access to the website in real-time. The information such as rainfall intensity on the pitch in millimeters was monitored over 24 hours. The information on vibration, in Richter scale, was observed by Arduino SW-420-NC sensor calibrated through Netigen program Smart Vibration Meter, which was able to detect tremors >3 RS. The rainfall intensity was detected more than >50 mm by the raindrop sensor. We have also measured the throughput, delay, packet loss ratio and RSSI with Wireshark program.