
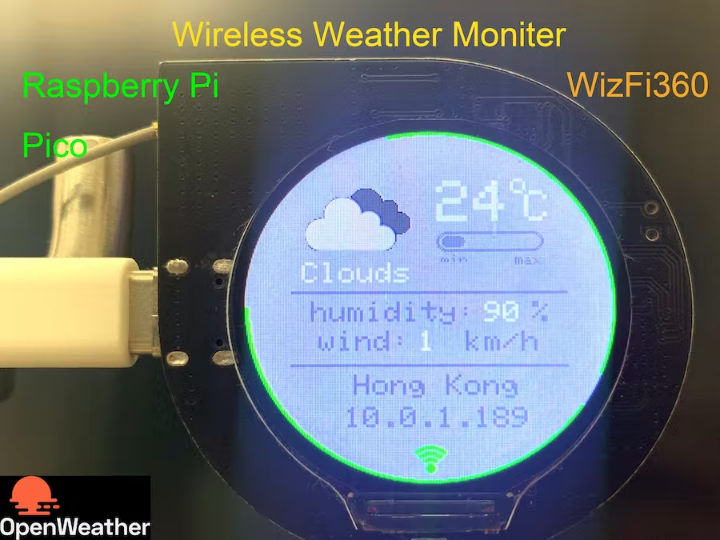
Wireless Weather Monitor(Raspberry Pi Pico & WizFi360 & Openweather)
Use Raspberry Pi RP2040 & WizFi360 to display Weather info through openweather API on the screen(GC9A01)
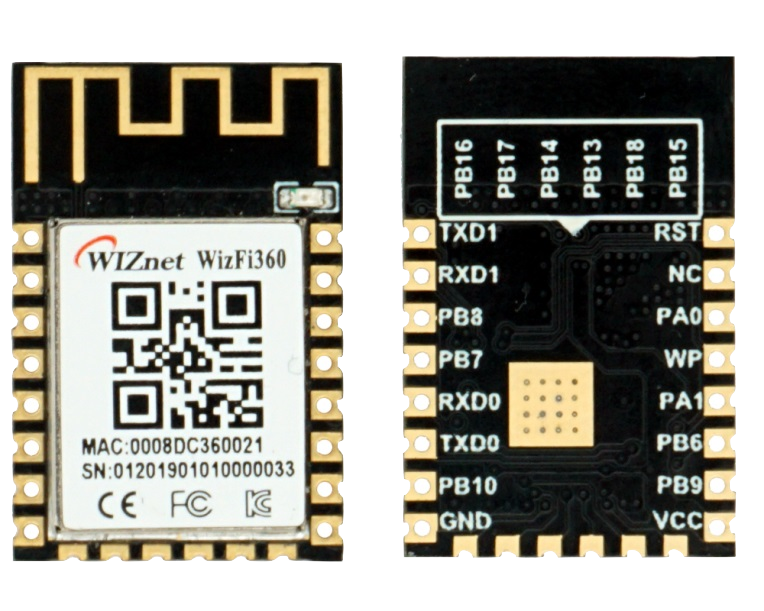
WIZnet - WizFi360
x 1

Raspberry Pi - RP2040
x 1
nc - GC9A01 1.28 Inch Round LCD
x 1

Arduino - Arduino IDE
x 1
I want to display the weather conditions on a screen, such as temperature、humidity、wind speed and other information.
In this project, I use the openweather API to get local weather information.
The website of openweather is “https://openweathermap.org/api”.

The openweather has variety of APIs for querying. The following figure is an introduction to some APIs.

I am using "Current Weather Data" this time which could access current weather data for any location including over 200,000 cities,and it replies in JSON format.
I use wizfi360 as http client to send weather request and get weather parameters. WizFi360 is a WiFi module, which can connect to WiFi through commands and perform TCP or TCP (SSL) connections. I have used it many times and it is very convenient.
RP2040 acts as an MCU, after get weather conditions from wizfi360, it performs data processing and displays the content on the screen.
This project is divided into four steps:
Step 1: Create New Account on the openweather website and get {API key};
Step2: Install library files and board support in the Arduino IDE;
Step 3: Get parameters from openweather API through WizFi360;
Step 4: Displays the weather conditions on the screen(GC9A01);
The following are step by step instructions.
Step 1: Create New Account on the openweather website and get {API key};
Create New Account and login the website. you could find your API keys.

Please confirm that the status of the api key is activated.

I am using a free account service, and the free service limits are as follows.

However, it is quite sufficient for personal use.
Step2: Install library files and board support in the Arduino IDE;
Add "WIZnet WizFi360-EVB-PICO" support to Arduino IDE
Open up the Arduino IDE and go to File->Preferences.
In the dialog that pops up, enter the following URL in the "Additional Boards Manager URLs" field:
https://github.com/earlephilhower/arduino-pico/releases/download/global/package_rp2040_index.json

Search "WizFi360" and Install Board support by "Board Manager"

"Tools->Board:"***"-> Raspberry Pi RP2040 Boards(2.6.1) " Select “WIZnet WizFi360-EVB-PICO”.

Add “GFX Library for rduino”, this library support the round screen GC9A01.

Step 3: Get parameters from openweather API through WizFi360;
#include "WizFi360.h"

// Wi-Fi info //
char ssid[] = "WIZNET_test";       // your network SSID (name)//
char pass[] = "********";          // your network password//
int status = WL_IDLE_STATUS;       // the Wifi radio's status//
WiFiServer server(5051);
Initialize serial port for WizFi360 module and change the baudrate to 2000000bps(MAX baudrate for wizfi360).
The first initialization is 115200, and then setting the baud rate (2000000) is added to the initialization part of the WiZfi360 library, and the second time is changed to 2000000bps.
// initialize serial port for WizFi360 module//
#if defined(ARDUINO_WIZNET_WIZFI360_EVB_PICO)
  Serial2.begin(2000000);
  WiFi.init(&Serial2);
  Serial2.begin(2000000);
#endif
Check the wizfi360 Link status of wifi in the “void setup()”
// check for the presence of the shield//
  if (WiFi.status() == WL_NO_SHIELD) {
    Serial.println("WiFi shield not present");
    // don't continue//
    while (true);
  }
  // attempt to connect to WiFi network//
  while ( status != WL_CONNECTED) {
    Serial.print("Attempting to connect to WPA SSID: ");
    Serial.println(ssid);
    // Connect to WPA/WPA2 network//
    status = WiFi.begin(ssid, pass);
  }
  Serial.println("You're connected to the network");
Create a TCP Socket on port 80 of the “openweathermap.org” and send request to API.
case link_weather_server:
       {
        // if you get a connection, report back via serial
        if (client.connect(weather_server,80)) {
          Serial.println("Connected to server");
          // Make a HTTP request
          client.println(String("GET /data/2.5/weather?lat=22.428&lon=114.210&appid=") + String(weather_appid) + String(" HTTP/1.1"));
          client.println(String("Host:") + String(weather_server));
          client.println("Connection: close");
          client.println();
          data_now = 0;
        }
        currentState = get_weather_data;
       }
      break;
The format and examples of api requests are as follows:
https://api.openweathermap.org/data/2.5/weather?lat={lat}&lon={lon}&appid={API key}
Where {lat} {lon} is the local geographic coordinates, and {API key} is the key obtained in step 1.
Local geographic coordinates can be queried in Google maps, or obtained through the API https://openweathermap.org/api/geocoding-api.

After that, wizFi360 can get the weather information JSON returned by the API.
Example of API response
{ "coord": { "lon": 10.99, "lat": 44.34 }, "weather": [ { "id": 501, "main": "Rain", "description": "moderate rain", "icon": "10d" } ], "base": "stations", "main": { "temp": 298.48, "feels_like": 298.74, "temp_min": 297.56, "temp_max": 300.05, "pressure": 1015, "humidity": 64, "sea_level": 1015, "grnd_level": 933 }, "visibility": 10000, "wind": { "speed": 0.62, "deg": 349, "gust": 1.18 }, "rain": { "1h": 3.16 }, "clouds": { "all": 100 }, "dt": 1661870592, "sys": { "type": 2, "id": 2075663, "country": "IT", "sunrise": 1661834187, "sunset": 1661882248 }, "timezone": 7200, "id": 3163858, "name": "Zocca", "cod": 200}A detailed explanation of each parameter is queried on this page:
“https://openweathermap.org/current”.
The following is the parameter parsing process.
case get_weather_data:
       {
          while (client.available()) {
            myBuffer.push(client.read());
            data_now =1;
          }
          if(data_now)
          {
            json_String = "";
            json_start = false;
            while (myBuffer.pop(value)) {
              //Serial.print((char)value);
              if(value == '{')
              {
                json_start = true;
              }
              if(json_start)
              {
                json_String += (char)value;
              }
            }
            dataStart = json_String.indexOf("icon") + strlen("icon") + 3;
            dataEnd = json_String.indexOf("}", dataStart) - 1;
            dataStr = json_String.substring(dataStart, dataEnd);
            weather_icon_num = dataStr;

            dataStart = json_String.indexOf("main") + strlen("main") + 3;
            dataEnd = json_String.indexOf(",", dataStart) - 1;
            dataStr = json_String.substring(dataStart, dataEnd);
            weather_main = dataStr;
            tft->fillRect(35,90,120,20,LIGHTGREY);
            tft->setTextColor(WHITE);
            if(weather_main.length()==4)
            {
              tft->setCursor(40, 90);
            }
            else
            {
              tft->setCursor(37, 90);
            }
            tft->setTextSize(2);
            tft->println(weather_main);

            dataStart = json_String.indexOf("temp") + strlen("temp") + 2;
            dataEnd = json_String.indexOf(".", dataStart);
            dataStr = json_String.substring(dataStart, dataEnd);
            weather_temperature = dataStr.toInt()-272;

            dataStart = json_String.indexOf("temp_min") + strlen("temp_min") + 2;
            dataEnd = json_String.indexOf(".", dataStart);
            dataStr = json_String.substring(dataStart, dataEnd);
            weather_temperature_min = dataStr.toInt()-272;

            dataStart = json_String.indexOf("temp_max") + strlen("temp_max") + 2;
            dataEnd = json_String.indexOf(".", dataStart);
            dataStr = json_String.substring(dataStart, dataEnd);
            weather_temperature_max = dataStr.toInt()-272;

            tft->drawRoundRect(129,72,64,8,5,LIGHTGREY);
            uint8_t temp_uint8 = (weather_temperature*64)/(100*(weather_temperature_max-weather_temperature_min));
            tft->fillRoundRect(129,72,temp_uint8,8,8,DARKGREY);

            tft->fillRect(125,34,45,30,LIGHTGREY);
            tft->setCursor(125, 34);
            tft->setTextSize(4);
            tft->println(weather_temperature);

            dataStart = json_String.indexOf("humidity") + strlen("humidity") + 2;
            dataEnd = json_String.indexOf(",", dataStart);
            dataStr = json_String.substring(dataStart, dataEnd);
            weather_humidity = dataStr.toInt();
            tft->fillRect(156,117,20,20,LIGHTGREY);
            tft->setTextColor(WHITE);
            tft->setTextSize(2);
            tft->setCursor(156, 117);
            tft->print(weather_humidity);

            dataStart = json_String.indexOf("speed") + strlen("speed") + 2;
            dataEnd = json_String.indexOf(",", dataStart)-1;
            dataStr = json_String.substring(dataStart, dataEnd);
            weather_wind = dataStr.toInt();
            tft->fillRect(113,137,30,20,LIGHTGREY);
            tft->setCursor(113, 137);
            tft->print(weather_wind);

            dataStart = json_String.indexOf("name") + strlen("name") + 3;
            dataEnd = json_String.indexOf("\"", dataStart);
            dataStr = json_String.substring(dataStart, dataEnd);
            weather_local = dataStr;

            client.stop();
            delay(500);
            data_now = 0;

            if(weather_icon_num.length()!=0)
            {
                currentState = link_icon_server;
            }else{
                currentState = link_weather_server;
            }
          }
       }
      break;
what we mainly need is:
weather.mainGroup of weather parameters (Rain, Snow, Extreme etc.)weather.iconWeather icon idmain.tempTemperature. Unit Default: Kelvin, Metric: Celsius, Imperial: Fahrenheit.main.humidityHumidity, %main.temp_minMinimum temperature at the moment. This is minimal currently observed temperature (within large megalopolises and urban areas). Unit Default: Kelvin, Metric: Celsius, Imperial: Fahrenheit.main.temp_maxMaximum temperature at the moment. This is maximal currently observed temperature (within large megalopolises and urban areas). Unit Default: Kelvin, Metric: Celsius, Imperial: Fahrenheit.wind.speedWind speed. Unit Default: meter/sec, Metric: meter/sec, Imperial: miles/hour.
Where “weather.icon” is the icon file we need to download below.

How to get icon URL:
For code 500 - light rain icon = "10d". See below a full list of codes
URL is http://openweathermap.org/img/wn/10d@2x.png
case link_icon_server:
       {
           // if you get a connection, report back via serial
          if (client.connect(weather_icon_server,80)) {
            Serial.println("Connected to weather_icon_server");
            // Make a HTTP request
            //https://openweathermap.org/img/wn/10d@4x.png
            //client.println(String("GET /img/wn/10d@2x.png HTTP/1.1"));  //@2x 100px*100px
            client.println(String("GET /img/wn/") + String(weather_icon_num) + String("@2x.png HTTP/1.1"));  //@2x 100px*100px
            //client.println(String("GET /img/wn/") + String(weather_icon_num) + String(".png HTTP/1.1"));
            client.println(String("Host:") + String(weather_icon_server));
            client.println("Connection: close");
            client.println();
            data_now = 0;
        }
        json_String = "";
        currentState = get_weather_icon;
       }
      break;

     case get_weather_icon:   {
          while (client.available()) {
            json_String += (char)client.read();
            data_now =1;
          }
          if(data_now)
          {
            dataStart = json_String.indexOf("Content-Length: ") + strlen("Content-Length: ");
            dataEnd = json_String.indexOf("\n", dataStart);
            dataStr = json_String.substring(dataStart, dataEnd);
            weather_icon_len = dataStr.toInt();
            dataStart = json_String.indexOf("Accept-Ranges: bytes")+ strlen("Accept-Ranges: bytes")+4;
            dataStr = json_String.substring(dataStart, json_String.length());
            uint16_t weather_icon_cnt;
            weather_icon_cnt = weather_icon_len + dataStart - json_String.length();
            while(weather_icon_cnt>0)
            {
              while(client.available()){
              dataStr += (char)client.read();
              weather_icon_cnt--;
              }
            }
            client.stop();
            data_now = 0;
            currentState = display_status;
          }
       }
      break;
and display it on the screen as follows:
case display_status:
       {
          int rc = png.openRAM((uint8_t *)dataStr.c_str(), weather_icon_len, PNGDraw);
          if (rc == PNG_SUCCESS) {
            char szTemp[256];
            sprintf(szTemp, "image specs: (%d x %d), %d bpp, pixel type: %d\n", png.getWidth(), png.getHeight(), png.getBpp(), png.getPixelType());
            Serial.print(szTemp);
            rc = png.decode(NULL, 0); // no private structure and skip CRC checking
            png.close();
          } // png opened successfully
          else
          {
            Serial.println("ERROR");
          }
          currentState = wait_timeout;
       }
      break;
Step 4: Displays the weather conditions on the screen(GC9A01);
#include <Arduino_GFX_Library.h>
Arduino_GFX *tft = create_default_Arduino_GFX();
define of pin which is used by GC9A01 in the "libraries\GFX_Library_for_Arduino\src\Arduino_GFX_Library.h"

#elif defined(ARDUINO_RASPBERRY_PI_PICO)||defined(ARDUINO_WIZNET_WIZFI360_EVB_PICO)||defined(ARDUINO_WIZNET_5100S_EVB_PICO)
#define DF_GFX_SCK 26
#define DF_GFX_MOSI 27
#define DF_GFX_MISO GFX_NOT_DEFINED
#define DF_GFX_CS 25
#define DF_GFX_DC 23
#define DF_GFX_RST 28
#define DF_GFX_BL 22
Initialize the screen and open the backlight of the screen in the “void setup()”
tft->begin();
  tft->fillScreen(BLACK);
  pinMode(22, OUTPUT);
  digitalWrite(22, HIGH);
  Display_Begin();
In order to display the interface beautifully, we write the framework of the interface during "Setup()".
void display_dashboard()
{
//tft->fillRect(119,30,2,180,DARKGREY);
tft->setCursor(173, 29);
tft->setTextSize(2);
tft->println("o");
tft->setCursor(182, 41);
tft->setTextSize(3);
tft->println("C");
tft->drawRoundRect(125,69,70,14,7,DARKGREY);
tft->drawRoundRect(126,70,68,12,6,DARKGREY);
tft->setTextColor(DARKGREY);
tft->setTextSize(1);
tft->setCursor(128, 85);
tft->print("min max");
tft->fillRect(30,110,180,2,DARKGREY);
tft->setTextColor(DARKGREY);
tft->setTextSize(2);
tft->setCursor(43, 117);
tft->print("humidity: %");
tft->setCursor(48, 137);
tft->print("wind: km/h");
tft->fillRect(30,160,180,2,DARKGREY);
tft->setCursor(71, 167);
tft->print("Hong Kong");
tft->setCursor(65, 189);
tft->print(ip);
tft->fillArc(120,120, 118, 120, 0, 360, GREEN);
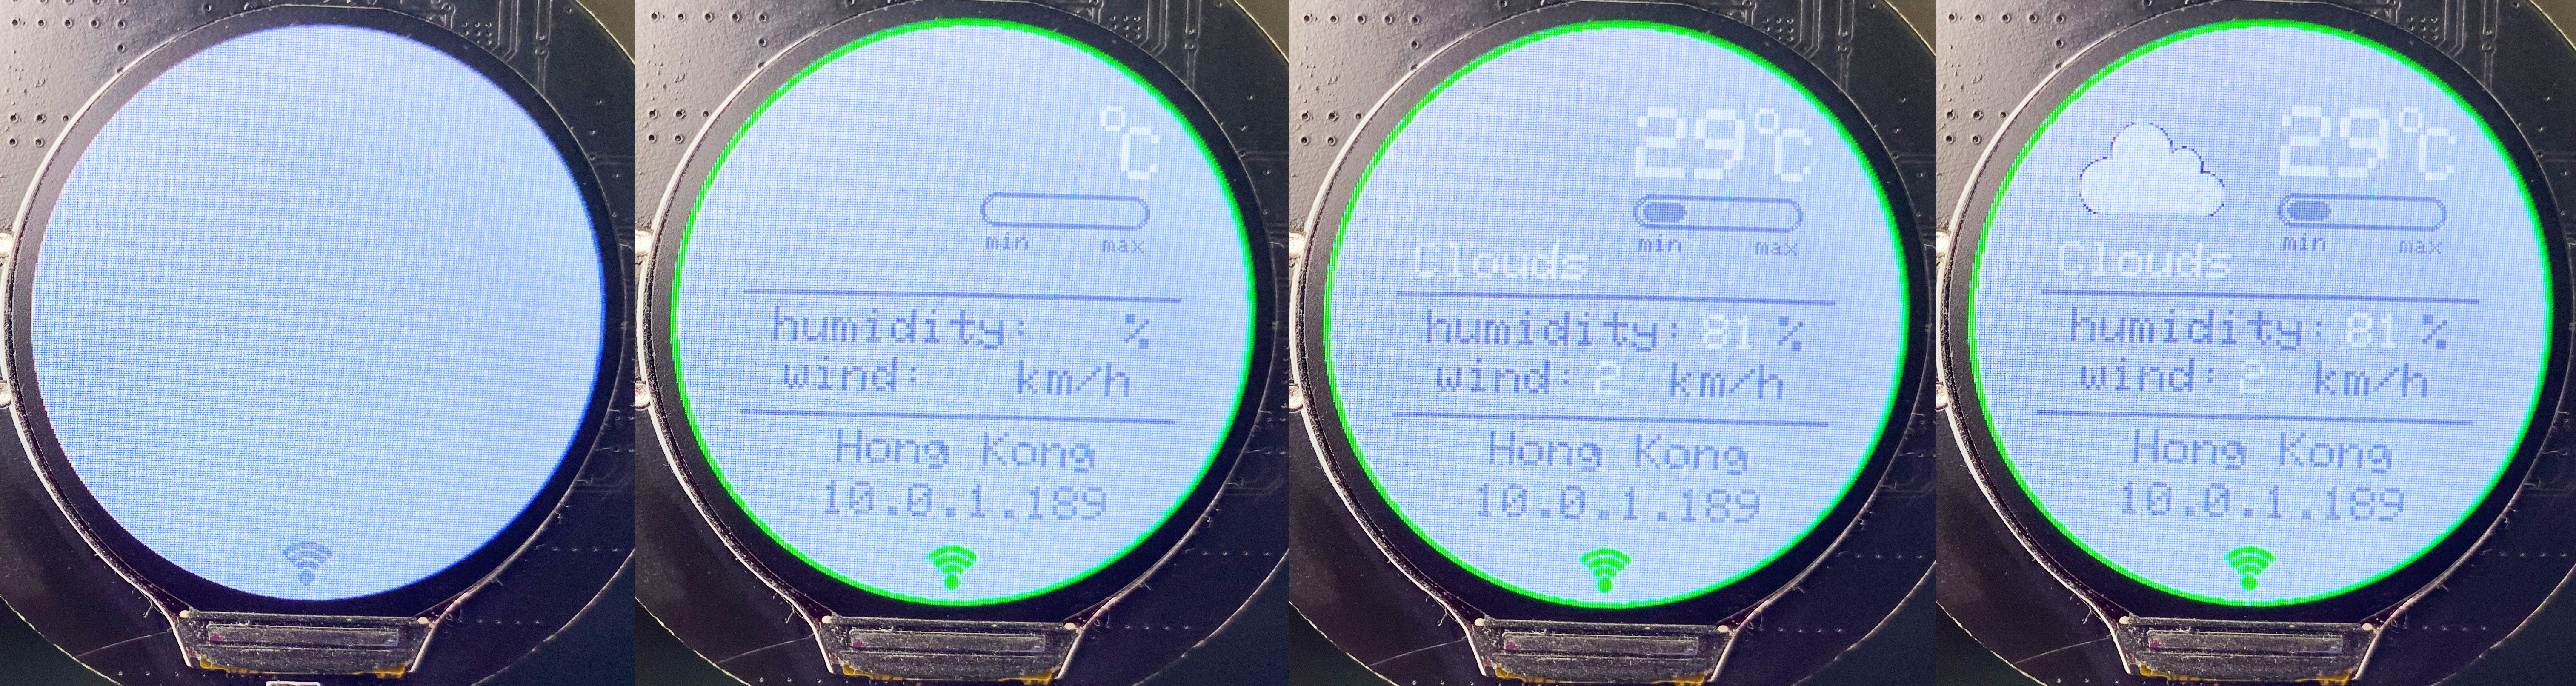
}At this time the screen displays as follows:
power up when connect the wifi:

After get the parameters in STEP3, through the following processing, update the screen display as local weather info.

We also need to display the obtained icon file in STEP3. The icon file is in PNG format, and the display part of the PNG format is as follows:
// Function to draw pixels to the display
void PNGDraw(PNGDRAW *pDraw)
{
  uint16_t usPixels[240];
  uint8_t usMask[240];
  // Serial.printf("Draw pos = 0,%d. size = %d x 1\n", pDraw->y, pDraw->iWidth);
  png.getLineAsRGB565(pDraw, usPixels, PNG_RGB565_LITTLE_ENDIAN, 0x00000000);
  png.getAlphaMask(pDraw, usMask, 1);
  tft->draw16bitRGBBitmap(23, 10 + pDraw->y, usPixels, usMask, pDraw->iWidth, 1);
}
Because of the limitation of the free account, and the change of the weather information will not be too fast, so I set to reacquire the data every 5 minutes, and there is a countdown indicator on the outer edge of the screen.

Below is a video demo of the project.
-
Wireless_Weather_Moniter_code

-
Wireless_Weather_Moniter_Schmatic